Hi, what do you want to do?
Curated OER
Don't Crack Humpty
Young scholars investigate the engineering design process and the relationship between distance, time, and speed. Using a generic car base, small groups design a device that will protect an egg on or in the car as it is rolled down a...
Curated OER
Equations in Motion: Design and construct a mobile
Students participate in a lesson that covers the concepts of solving equations and inequalities. To master the concept they must demonstrate visually and verbally how both sides of an equation must be balanced. They construct a balanced...
Curated OER
Symbols of Freedom
Students investigate symbols of the United States in this unit. They exam the Liberty Bell, the American Flag, the President, and the Bald Eagle.
Curated OER
The X-33 and the X-38
Students explore the relationships among the lengths, areas, and volumes of similar solids. They also discover what effect doubling the dimensions of a figure has on the resulting area.
Curated OER
Wings and Othe Things
Students work in groups that are engaged in different activities at different times. They watch the video "Madagascar" and collect data pertaining to the Fish Eagle's arm spam. They work together to perform mathematical computations...
Curated OER
Cartesian Coordinate System
Students research the Cartesian Coordinate System and its many uses in the world of mathematics and algebra.
Curated OER
What Are The Chances
Students calculate the probability of an event occurring. In this probability lesson, students differentiate between independent, dependent or compound events. They find the range of the data.
Pennsylvania Department of Education
Analyzing Numeric and Geometric Patterns of Paper Pool
Students use concrete and pictorial representation of geometric patterns to extend patterns. In this geometric patterns lesson plan, students identify patterns and extend them.
Curated OER
Means of Growth
High schoolers collect and graph data. In this statistics lesson, students analyze their plotted data using a scatter plot. They identify lines as having positive, negative or no correlation.
Curated OER
Walking on Air
Students collect and analyze data with a graph. In this statistics lesson, students use central tendencies to find the meaning of their data. They display the data on a Ti calculator.
Curated OER
Gyrocopters-Producing Rotary Motion
Students demonstrate rotary motion by practicing with gyrocopters. In this physics lesson students work in groups to construct a gyrocopter and explore how physics effect it torque and inertia.
Curated OER
Optimization For Breakfast
Students identify he proportion of a cereal box. In this algebra lesson, students define the relationship between patterns, functions and relations. They model their understanding using the cereal box.
Curated OER
Creating a "Concrete" Spreadsheet
Students create a spreadsheet that calculate the amount of concrete needed to pour various concrete forms.
Curated OER
What are the Odds
Students predict the-outcome of an event. In this algebra lesson plan, students compare and contrast the probability of an event occurring. They calculate the odds of a simple event and make estimation.
Curated OER
Power Metering Project
Students collect and analyze variable data and understand the concept of electrical power. In this energy lesson students use a spreadsheet to manage their data and create box plots.
Curated OER
Light Bounce
Students solve problems involving triangles. In this geometry lesson, students apply properties of triangles to find the missing angles and sides. They identify angles of parallel lines cut by a transversal.
Curated OER
Pythagorean Theorem
Students solve problems using the Pythagorean Theorem. In this geometry lesson, students identify the sides and angles of a right triangle. They find the different trigonometric ratios and solve using sine, cosine and tangent.
Curated OER
Geometric Probablitiy: Spinners and Dartboards
Sstudents explore and analyze the properties of geometric areas. In this geometry lesson, sstudents use technology to simulate spinners and dartboards in order to fing areas of circles and sectors of circles and compare and...
Curated OER
Hot Wheels
Young scholars observe the action produced by toy cars. In this geometry lesson, students discuss motion and distance as they relate to the movement of a spherical object.They collect data and make conjectures based on their data.
Curated OER
Graphs and Functions
Students are introduced to plotting functions on the Cartesian coordinate plane seen several categories of functions, including lines and parabolas
Curated OER
Shape Makes a Difference!
Students learn the difference between perimeter and area by watching a video and a hands on activity.
CK-12 Foundation
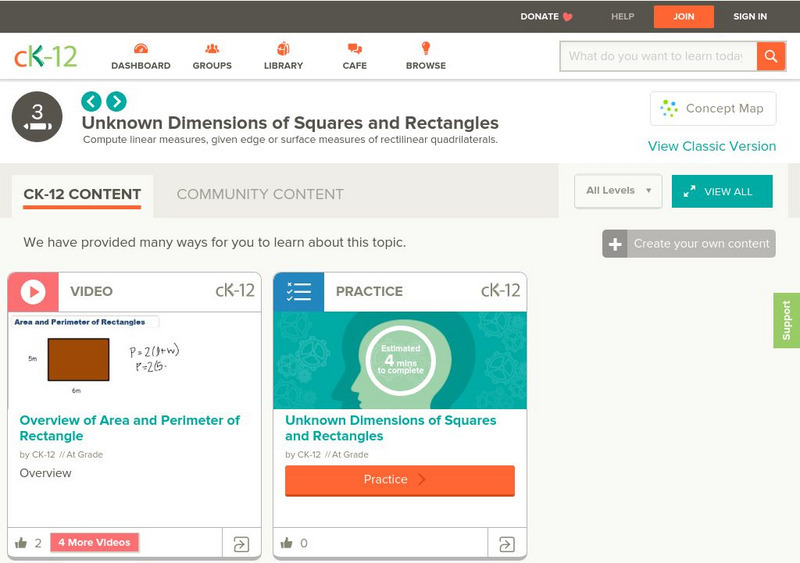
Ck 12: Elem Math: Unknown Dimensions of Squares and Rectangles (Grade 3)
[Free Registration/Login may be required to access all resource tools.] This learning module features five videos and a set of practice questions in which students learn to compute linear measures, given edge or surface measures of...
PBS
Pbs: Black Kingdoms of the Nile
A geometry instructional activity that examines the history and structure of ancient pyramids and engages students in constructing pyramid models. A comprehensive instructional activity that considers students with diverse learning...
Texas Instruments
Texas Instruments: Linear Regression: Wing Span/height
Students take measurements of individual's wing span and height and create a coordinate graph. The activity should include at least three different grade levels. Students submit an equation through "Activity Center" and the class...


