Virginia Department of Education
Heat Transfer and Heat Capacity
It's time to increase the heat! Young chemists demonstrate heat transfer and heat capacity in an activity-packed lab, showing the transitions between solid, liquid, and gaseous phases of materials. Individuals plot data as the...
Curated OER
What's My Ratio?
Students investigate ratios of various objects. In this ratios of various objects lesson, students draw pictures on graph paper and then dilate or shrink the image. Students determine the ratio of their pictures. ...
Curated OER
Discovering Pi
Students develop a formula that describes the functional relationship of the circumference of a circle to its diameter. Working with a partner, they measure the diameter and circumference of circular objects in order to discover the...
Curated OER
Cold Hard Facts? What Inquiring Minds Will Know -- Inquiry-Based Ice Investigations
Students are introduced to the concepts of perimter, diameter, circumference and measurements. In groups, they complete two worksheets in which they determine if the ice dimensions make a difference in the way it floats. They discuss...
Curated OER
Archaeological Self-Study: What Do Our Belongings and Trash Tell About Us?
Students examine how their belongings and their trash represents who they are. In this archaeology skills lesson, students watch a video titled "Discovering the Past" and then give archaeological techniques a try. Students examine and...
Curated OER
Exploring the Brass Family
Third graders explore the four basic instruments of the Brass Family in the four lessons of this unit. The French horn, trumpet, trombone, and tuba are inspected as students develope a familiarity with their sight and sounds.
Curated OER
Hoping Backward to Solve Problems
Young scholars use number lines to compare differences. In this math lesson, students use a number line to solve problems. Young scholars predict differences and answer puzzles using subtraction.
Pennsylvania Department of Education
Using the Number Line to Compare
Students determine differences using a number line. In this math lesson, students use the number line to solve subtraction problems. Students solve puzzles using subtraction.
Curated OER
The Farther Away You Are, The Faster Away You Move
Learners explore linear relationships. The lesson uses science to develop an understanding of the expanding Universe. There are 3 Labs, only 2 of which are required. Lab C is an enrichment for higher level classes.
Curated OER
Geometry of Exploration: Eyes Over Mars
Pupils research how engineers and scientists generate linear and angular measurements with geometry to survey the Earth and Mars. They assess how geometric shapes affect navigation. A surveyor comes to the classroom and explains how he...
Curated OER
My Peanut Butter is Better Than Yours!
Students explore the concept of statistical data. In this statistical data instructional activity, students read an article about the dangers of peanut butter to those who are allergic. Students perform a taste test of two different...
Curated OER
What Are The Chances
Students calculate the probability of an event occurring. In this probability lesson, students differentiate between independent, dependent or compound events. They find the range of the data.
Curated OER
Collecting the Rays
Learners investigate the affect shape has on the ability of a solar panel to collect sunlight. In this collecting sunlight using a solar panel lesson, students determine which solar panel shape collects the most sunlight. ...
Curated OER
Means of Growth
Students collect and graph data. In this statistics lesson, students analyze their plotted data using a scatter plot. They identify lines as having positive, negative or no correlation.
Curated OER
Graphing System of Equations
Students solve system of equation. In this algebra lesson, students graph, substitute and eliminate to solve system of equation. They identify the point of intersection and how many solution each system will have.
Alabama Learning Exchange
The State Capital of Stem and Leaf
Students explore the concept of stem and leaf plots. In this stem and leaf plots instructional activity, students plot the 50 US states' capitals on a stem and leaf plot according to the first letter of each state. ...
Pennsylvania Department of Education
Analyzing Numeric and Geometric Patterns of Paper Pool
Students use concrete and pictorial representation of geometric patterns to extend patterns. In this geometric patterns lesson plan, students identify patterns and extend them.
Curated OER
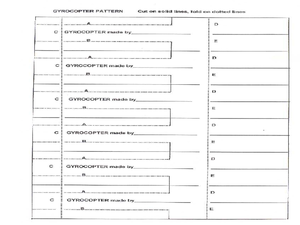
Gyrocopters-Producing Rotary Motion
Students demonstrate rotary motion by practicing with gyrocopters. For this physics lesson students work in groups to construct a gyrocopter and explore how physics effect it torque and inertia.
Curated OER
Walking on Air
Learners collect and analyze data with a graph. In this statistics lesson, students use central tendencies to find the meaning of their data. They display the data on a Ti calculator.
Curated OER
Polygon Perimeters
Students complete worksheets where they calculate the perimeter of polygons. In this perimeter of polygons lesson plan, students divide complex shapes into simple shapes to find the perimeter.
Curated OER
Optimization For Breakfast
Students identify he proportion of a cereal box. In this algebra lesson, students define the relationship between patterns, functions and relations. They model their understanding using the cereal box.
Curated OER
Pythagorean Theorem
Students solve problems using the Pythagorean Theorem. In this geometry lesson, students identify the sides and angles of a right triangle. They find the different trigonometric ratios and solve using sine, cosine and tangent.
Curated OER
Time Trials
Pupils investigate speed, time and distance. In this algebra lesson, students utilize their knowledge of linear equations to solve problems related to time, speed and distance. This assignment is hands on using two toy race cars.
Curated OER
The Swinging Pendulum
Students observe a pendulum and graph their observation. In this algebra lesson, students use the TI calcualtor to graph the motion the pendulum makes. They analyze the graph and make predictions.


