CK-12 Foundation
Irwin 2D
Learners explore two-dimensional motion through visual modeling with an interactive lesson that allows them to control the path of a robot. Graphs show both the horizontal and vertical motion as the robot continues through its entire route.
Curated OER
Polynomials Functions
High schoolers factor polynomials and linear functions and apply concepts of the fundamental theorem of algebra to solve problems. They graph their solutions and analyze the graph.
Illustrative Mathematics
High School Graduation
An exercise in finding the approximate time that a name would be called at a graduation. Estimating time may be difficult for some of the class, so this resource would not be a good choice for learning this standard. It does end with a...
Virginia Department of Education
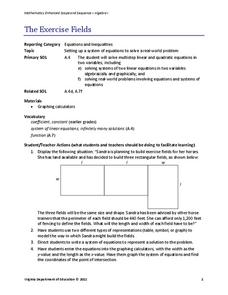
The Exercise Fields
Horses need exercise, too. Scholars create linear equations to model the perimeter of exercise fields for horses. They finish by solving their equations for the length and width of the fields.
Virginia Department of Education
Spring Fling Carnival
Think critically — and linearly by applying linear equations to solve real-world problems. Young mathematicians write equations to model the profit on popcorn and cotton candy at a carnival and solve problems using these equations.
101 Questions
Coins in a Circle
Round and round you'll go! Learners watch as different-sized circles fill with coins. They collect data and then make a prediction about the number of coins that will fit in a large circular rug.
PBL Pathways
Students and Teachers
Predict the future of education through a mathematical analysis. Using a project-based learning strategy, classes examine the pattern of student-to-teacher ratios over a period of years. Provided with the relevant data, learners create a...
Balanced Assessment
Fit-Ness
Serve four towns with one bus route. Pupils develop a bus route that meets certain criteria to serve four towns. They determine which of the routes would best serve all of them. Individuals then hypothesize where a fifth town should be...
PBS
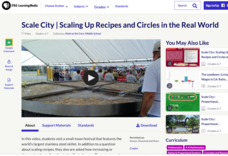
Scale City — Scaling up Recipes and Circles in the Real World
What a great big skillet you have. The resource introduces the class to the world's largest stainless steel skillet. The class creates a model of the skillet and a typical 12-inch skillet and compares the relative sizes of their areas....
National Gallery of Canada
Mastering One-Point Perspective
Cover one-point perspective through observation and practice. Class members examine several works of art that use one-point perspective, look at magazine images to find the vanishing points and horizon lines, and draw their own city...
Kenan Fellows
How Does an Unhealthy Diet Influence our Health and Well-Being?
You are what you eat, or so they say! After surveying family and friends on a week of eating habits, learners analyze the data for patterns. They compare different variables such as fats and cost, fats and calories, or fats and LDLs.
Balanced Assessment
Transformation II
Develop a solid understanding of the manipulation of expressions to produce equivalent expressions. Given an expression, pupils rearrange it to create a new one. Their new functions must match the structure of the model expressions.
CK-12 Foundation
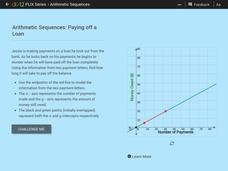
Arithmetic Sequences: Paying of a Loan
How long does it take to pay off a loan? Pupils use a graph to model the sequence associated with paying off a loan. Using the graph, learners determine the initial value and the common difference of the arithmetic sequence. The learners...
Chemistry Collective
Chemical Potential: Staircase Demonstration
It's all uphill from here! Scholars examine the pattern of random particle motion up a staircase. The simulation shows how the linear increase in energy corresponds to an exponential decrease in particle concentration.
Curated OER
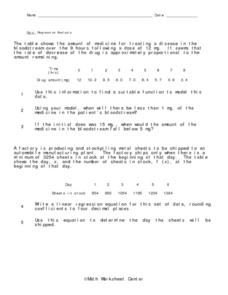
Regression Analysis
In this regression analysis worksheet, 9th graders solve 10 different word problems related to regression analysis. First, they use the information given to find a suitable function to model the data. Then, students use the model to...
Curated OER
I Can Do This! Systems of Equations
Students solve systems of 2-by-2 linear equations using tables,
graphs and substitution. In small groups, classmates work together to discover strategies for solving equations. They use a calculator to graphically represent their answers.
Curated OER
Projectile Motion Lab
In this physics worksheet, learners model the position, velocity and acceleration using mathematical formulas and a computer program. Then they interpret the parameters in each of the models. Students also complete the experiment and...
Curated OER
Graphing Real World Situations
Students solve linear equations using graphs. In this algebra lesson, students depict real life situation using lines and functions. They identify the slope, data and predict graphing behavior.
Curated OER
Count the Differences
Pupils find the difference between consecutive y-values on the calculator and write an equation that fits the data. They continue finding the differences in consecutive y-values using lists on their calculator. Learners conclude as they...
Curated OER
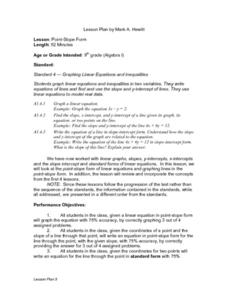
Point-Slope Form
Ninth graders explore the point-slope form of linear equations and graph lines in the point-slope form. After completing the point-slope equation, they identify the slope of a line through a particular point. Students explain the...
Curated OER
Guess the Age
Students describe graphically, algebraically and verbally real-world phenomena as functions; identify the independent and the dependent variable. They translate among graphic, algebraic, and verbal representations of relations and graph...
Curated OER
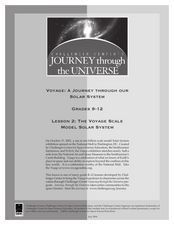
The Voyage Scale
Young scholars identify how models are powerful tools of exploration and that the sizes of the planets and distances between the planets in the Solar System span a large range. They make a sign for each planet they have created in the...
Curated OER
Using Inequalities to Problem Solve
Students explore inequalities. In this Algebra I instructional activity, students solve and graph linear inequalities involving addition, subtraction, multiplication, or division. Students use inequalities to solve and graph real-world...
Curated OER
Graphing Integers
Fifth graders explore the math concept of graphing integers. In this graphing integers instructional activity, 5th graders examine visual examples. Students also practice solving problems that their instructors model.
Other popular searches
- Linear Model Ling
- Linear Models and Fractions
- Non Linear Models
- Modeling Linear Data
- Fractions Linear Model
- More Linear Models
- Predicting Linear Models


