Curated OER
Surface Area and Volume of a Cube
Students explore finding the surface area and volume of cubes and cylinders. They construct similar three-dimensional figures from a two-dimensional drawing. Students derive the formula for volume and surface area through examination...
Curated OER
The X-33 and the X-38
Learners explore the relationships among the lengths, areas, and volumes of similar solids. They also discover what effect doubling the dimensions of a figure has on the resulting area.
Curated OER
The Cuisenaire Four-Pan Algebra Balance: Limitations and Suggestions
Learners illustrate the concept of balancing equations using a Four-Pan Algebra Balance. In this balancing lesson, students visualize why it is necessary to add or subtract the same quantity on both sides of an equation when solving...
Curated OER
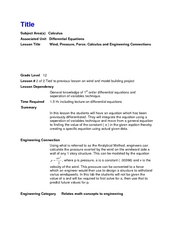
Wind, Pressure, Force, Calculus and Engineering Connections
Twelfth graders solve first order differential equations using the separation of variables technique. In this calculus lesson, 12th graders explain the connection between math and engineering. They brainstorm what engineers do in real life.
Curated OER
Fortunately, An Analogy
First graders produce a writing based on the story, "Fortunately,". They publish it as a slide show.
Curated OER
Spring Slide Show
First graders work cooperatively to create a sprintime poem, slide show and book entitled "Who Said It's Spring?"
Curated OER
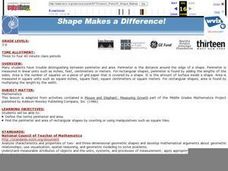
Shape Makes a Difference!
Young scholars learn the difference between perimeter and area by watching a video and a hands on activity.
Curated OER
Renkly Relief/Collage Painting
Students study the use of texture, and rhythm as a principle of design when showing movement in a painting.
Curated OER
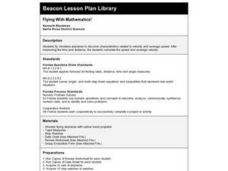
Flying With Mathematics!
Third graders fly miniature airplanes to discover characteristics related to velocity and average speed. After measuring the time and distance of their flights, 3rd graders calculate the average velocity of their planes.
Curated OER
Graphing With RXTE
Students use data from the Rossi X-ray Tiiming Explorer (RXTE) satellite to analyze and graph.
Curated OER
String of Fish
Fourth graders research a Florida fish to determine its length. They display this information on two index cards, which are cut to the shape of the head and the tail and attached to a string that they measure and cut to the correct...
Curated OER
Can You Dig It?
Learners investigate a fossil site and diagram a site map. They role play as paleontologists.
Curated OER
Hibernating Hoopla
Students simulate hibernation with their stuffed animals. They predict the length of time of hibernation and type their math journal entries about sorting, graphing and draw pictures. They read bear hibernation stories.
Curated OER
Black Bayou Lake Measures Up
Students, in groups, estimate measurments and then select the tools needed and measure various items at Black Bayou Lake refuge.
Curated OER
The Truth About Triangles and Squares
Fourth graders investigate the patterns associated with both triangular and square numbers. They use counters as manipulatives to depict the numbers as needed but focus on problem solving using mental math techniques.
Curated OER
Bubblegum balls
Students look for patterns to solve problems involving statistics using different colored gumballs. They should be able to look for and find out all the possible outcomes based upon inference and trials.
Curated OER
Bubble Gum Chemistry
Students explore the concept of graphing data. In this graphing data lesson, students determine the percentage of sugar in bubble gum. Students graph type of gum vs. sugar percentage. Students create a table of their data.
Curated OER
Building Paper Bridges
Students construct a bridge that can hold 100 pennies. In this math lesson, students evaluate the strength of their bridges. They predict how much weight a bridge can hold based on its design.
Other popular searches
- Linear Model Ling
- Linear Models and Fractions
- Non Linear Models
- Modeling Linear Data
- Fractions Linear Model
- More Linear Models
- Predicting Linear Models


