Curated OER
Means of Growth
High schoolers collect and graph data. In this statistics instructional activity, students analyze their plotted data using a scatter plot. They identify lines as having positive, negative or no correlation.
Curated OER
Cartesian Coordinate System
Students explore the Cartesian coordinate plane and plot points on the graph. They interpret coordinates for a point from the graph and give the ratio of rise over run for slope.
Alabama Learning Exchange
The State Capital of Stem and Leaf
Students explore the concept of stem and leaf plots. In this stem and leaf plots lesson, students plot the 50 US states' capitals on a stem and leaf plot according to the first letter of each state. Students compare...
Curated OER
Equations and Inequalities
Students in a college algebra class use graphs to solve inequalities. Using the coordinate graphing system, they represent the relationship between x and y intercepts. They practice solving equations with complex numbers and locate...
Curated OER
Whose Line is it Anyway?
Students solve systems of equations. In this algebra lesson plan, students identify the domain and range of each function. They use the slope and y-intercept to graph each line.
Curated OER
Circle Relationships
Students explore circles. In this geometry lesson, students explore the relationship between the circumference of a circle, the distance a ball travels, and the number of rotations the ball must make in order to travel a certain...
Curated OER
The Mandelbrot Set
Students are introduced to the notion of a complex number and function iteration in order to motivate the discussion of Julia sets and the Mandelbrot set.
Curated OER
Gyrocopters-Producing Rotary Motion
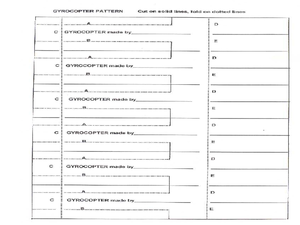
Students demonstrate rotary motion by practicing with gyrocopters. In this physics lesson students work in groups to construct a gyrocopter and explore how physics effect it torque and inertia.
Curated OER
How Atoms Work
Students analyze the way atoms function and how they combine to form molecules and various compounds. Using a software program, they create a diagram of an atom and write a summary about their functions. They complete a worksheet and...
Curated OER
How Atoms Work
Students explore the concept of atoms and how they combine to form molecules and compounds. In pairs, they read an article on how atoms work and discuss the main points. They draw atoms and write a paragraph about their elements.
Curated OER
The Function Elevator
Pupils solve and graph functions. In this precalculus lesson, students use piecewise function to relate real life scenarios. They analyze the graphs and identify the vertex and intercepts.
Curated OER
The Swinging Pendulum
Students observe a pendulum and graph their observation. In this algebra lesson, students use the TI calcualtor to graph the motion the pendulum makes. They analyze the graph and make predictions.
Curated OER
Skeeter Populations and Exponential Growth
Students perform investigations on the growth of populations and use exponential functions to represent that growth. They watch a video clip of growth patterns. Students work in groups to determine the "population" of each color of...
Curated OER
The Ideal Gas
In this ideal gas worksheet, students read about the conditions necessary for an ideal gas to exist. They also read about the deviations from the ideal gas situation and answer four questions about ideal gases.
Curated OER
Recognizing Patterns
Middle schoolers explore the concept of patterns. In this patterns lesson, students use applets to manipulate tessellations. Middle schoolers predict the next number in a sequence by recognizing patterns.
Curated OER
The Kangaroo Conundrum: A Study of a Quadratic Function
Students play a game and collect data for their graph. In this algebra lesson, students solve quadratic equations and identify properties of their graph. They describe the pattern created by the graph and the game.
Curated OER
A Study of a Quadratic Function
Young scholars factor and solve quadratic equations. In this algebra lesson, students play a game as the collect and graph data. they identify properties of their parabola and make predictions.
Curated OER
Exponential and Exponents Functions
Students solve problems using exponential properties. In this algebra instructional activity, students differentiate between exponents, exponential and log functions. They graph their functions using table and exponents.
Curated OER
Graphing and the Coordinate Plane
Students gain practice reading coordinates and plotting points by participating in the Coordinates! Game. They demonstrate and test their skills with graph paper and the Maze Game.
Curated OER
Dimensional Space: Various Perspectives
Students use their understanding of 3D on 2D to make a representation of a 4D form on paper.
Curated OER
Graphing Data from the Chemistry Laboratory
Students graph and analyze data using a spreadsheet.
Curated OER
Collecting And Fitting Quadratic Data
Young scholars investigate the concept of using quadratic data to plot coordinates on a plane. They also apply the quadratic formula for a variety of problems with the help of a graphing calculator to draw the parabola for given...
Curated OER
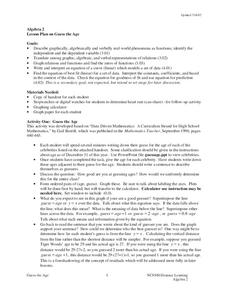
Guess the Age
Learners explore functions using real world application. In this algebra lesson, students play a game as they apply concepts of function. They graph their findings and discuss it with the class.
Curated OER
Guess the Age
Students rewrite word problems using symbols. In this algebra lesson plan, students rewrite equations graphically, algebraically and verbally. They relate the concepts to the real world.

