CK-12 Foundation
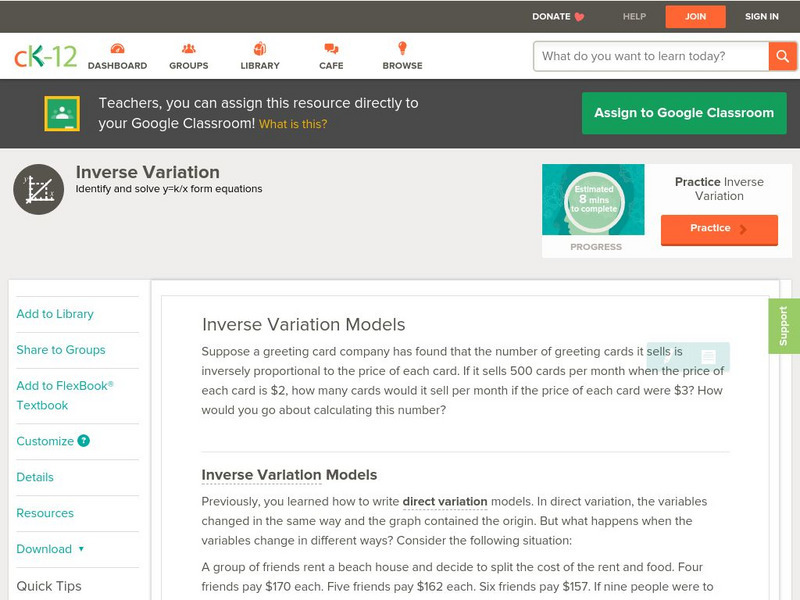
Ck 12: Algebra: Inverse Variation Models
[Free Registration/Login may be required to access all resource tools.] Learn how to solve problems involving inverse variation.
ClassFlow
Class Flow: Applications of Linear Systems
[Free Registration/Login Required] Students will learn how to use the best method to solve a system of linear equations and will use systems of linear equations to model real-life problems.
Wikimedia
Wikipedia: Linear Regression
Wikipedia explains the statistics term, "linear regression." Includes table of contents, hyperlinked terms, and formulas.
Other
Stat Soft: Statistics Glossary
Dozens of statistical terms are defined and illustrated in this glossary.
Concord Consortium
Concord Consortium: Population Curve: Significance of Breakpoints
Learn about three models of population growth: linear, exponential, and logistic. Then conduct a population experiment to see how populations can work in the real world, and see how linear graphs can help simplify complicated ones.
BBC
Bbc: Statistical Skills: Comparing Data Sets Using Statistics
This site is a demonstration of Comparing data sets using statistics and forming a linear model from a given set of data. Examples and a practice test are included.
Khan Academy
Khan Academy: Systems of Inequalities Word Problems
Solve word problems that involve systems of linear inequalities. Students receive immediate feedback and have the opportunity to try questions repeatedly, watch a video, or receive hints.
Texas Instruments
Texas Instruments: Home for the Holidays
Thanksgiving Holiday activity for Algebra students. Linear data taken from the internet and used to create a linear model of the class data.Students will then discover the slope of the line is the speed of the car in miles per hour....
Concord Consortium
The Concord Consortium: Molecular Workbench Linear vs. Branched Polymers
View the differences in intermolecular interactions between linear and branched polymers.
Missouri State University
Missouri State U.: Multivariate Statistics: Concepts, Models, and Applications
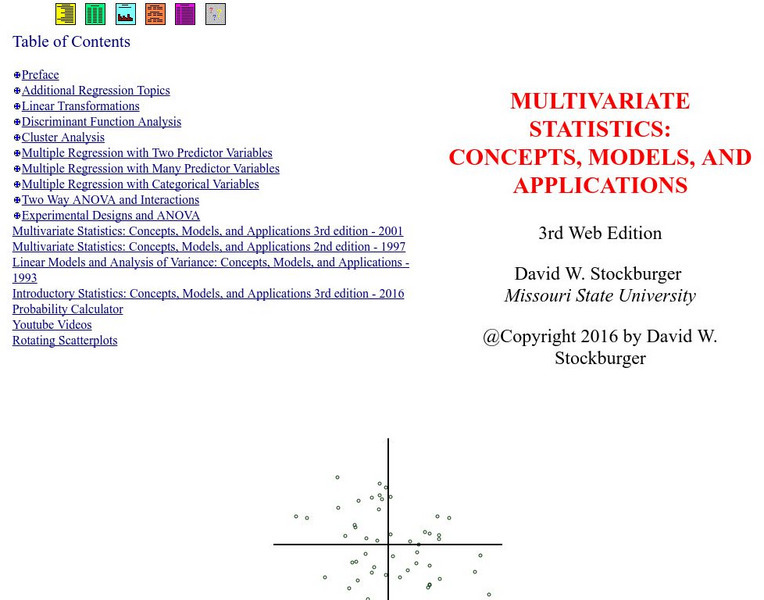
This site features an online textbook with very in-depth information about multivariable statistics. (NOTE: In the archived version, some images do not appear. However, many of them are multiple-choice questions for students, and if you...
Texas Instruments
Texas Instruments: Science Today More of u.s.
Students examine the USA TODAY Snapshot "More of U.S.", construct a graph from the data, produce a mathematical model (linear) for the data, determine the rate of change for the data, and make predictions about future population levels.
Illustrative Mathematics
Illustrative Mathematics: S Id.6a,7 Olympic Men's 100 Meter Dash
This task asks learners to identify when two quantitative variables show evidence of a linear association and to describe the strength and direction of that association. Students will use a scatterplot showing the finishing times for the...
Math Graphs
Houghton Mifflin: Math Graphs: Fitting Models to Scatter Plots 1 [Pdf]
Learners use a scatter plot to determine whether data can be modeled by a linear function, a quadratic function, a trigonometric function, or that there appears to be no relationship between x and y. The resource consists of an enlarged...
Math Graphs
Houghton Mifflin: Math Graphs: Fitting Models to Scatter Plots 2 [Pdf]
Students use a scatter plot to determine whether data can be modeled by a linear function, a quadratic function, a trigonometric function, or that there appears to be no relationship between x and y. The resource consists of an enlarged...
Math Graphs
Houghton Mifflin: Math Graphs: Fitting Models to Scatter Plots 3 [Pdf]
Students use a scatter plot to determine whether data can be modeled by a linear function, a quadratic function, a trigonometric function, or that there appears to be no relationship between x and y. The resource consists of an enlarged...
Math Graphs
Houghton Mifflin: Math Graphs: Fitting Models to Scatter Plots 4 [Pdf]
Students use a scatter plot to determine whether data can be modeled by a linear function, a quadratic function, a trigonometric function, or that there appears to be no relationship between x and y. The resource consists of an enlarged...
Math Graphs
Houghton Mifflin: Math Graphs: Fitting Models to Scatter Plots 7 [Pdf]
Learners use a given scatter plot to identify whether the data can be modeled by a linear, quadratic, or trigonometric function. The math graph is available in PDF format.
Math Graphs
Houghton Mifflin: Math Graphs: Fitting Models to Scatter Plots 8 [Pdf]
Learners use a scatter plot to identify whether the data can be modeled by a linear, quadratic, or trigonometric function. The math graph is available in PDF format.
ClassFlow
Class Flow: Fitting Models to Data
[Free Registration/Login Required] A basic premise of science is that much of the physical world can be described mathematically and many physical phenomena are predictable. This scientific outlook took place in Europe during the late...
Texas Instruments
Texas Instruments: Step by Step
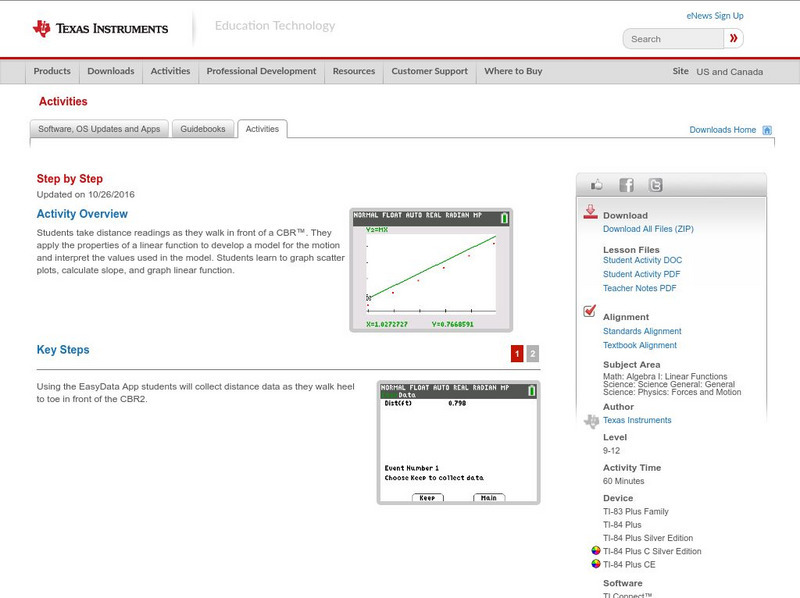
In this activity, students take distance readings as they walk in front of a CBR. They apply the properties of a linear function to develop a model for the motion and interpret the values used in the model. Students learn to graph...
Texas Instruments
Texas Instruments: Step by Step Activity Data Collection & Analysis
In this activity, students create a situation that produces linear behavior by stepping heel to toe and taking distance readings as each step is taken. Students then apply the properties of a linear function to develop a model for motion.
Texas Instruments
Texas Instruments: Da Vinci's Proportions
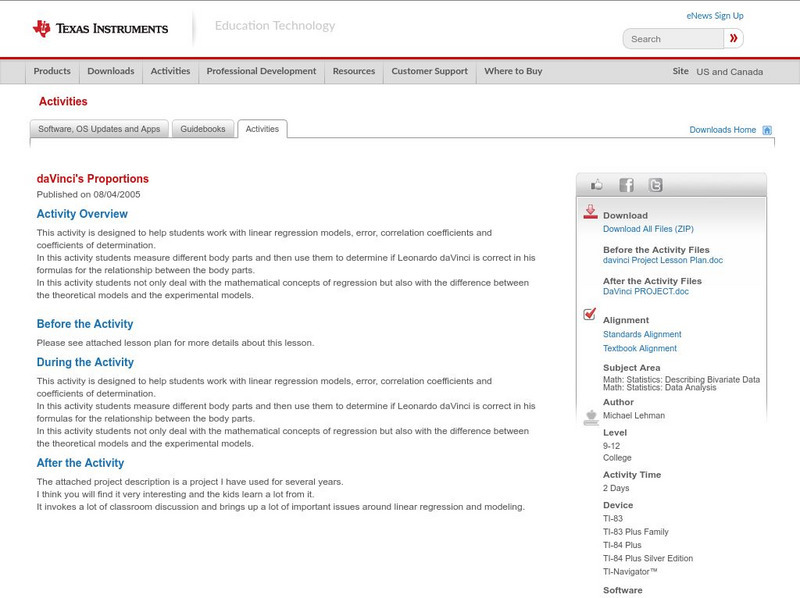
This activity is designed to help students work with linear regression models, error, correlation coefficients and coefficients of determination. In this activity students not only deal with the mathematical concepts of regression but...
Texas Instruments
Texas Instruments: Chill Out: How Hot Objects Cool
Students use a temperature probe to collect data as the warmed probe cools. Students investigate Newton's law of cooling and model cooling data with an exponential function. They fit the data to a mathematical model after analysis.
Texas Instruments
Texas Instruments: Math Today Challenge Heat Watch
Students will explore linear & quadratic functions to determine how they model the relationship between air temperature & heat index. Once the models are determined students will make predictions about heat index when given a...



![Houghton Mifflin: Math Graphs: Fitting Models to Scatter Plots 1 [Pdf] Unknown Type Houghton Mifflin: Math Graphs: Fitting Models to Scatter Plots 1 [Pdf] Unknown Type](https://d15y2dacu3jp90.cloudfront.net/images/attachment_defaults/resource/large/FPO-knovation.png)

