CK-12 Foundation
Linear Equations: Deep Dish Pizza
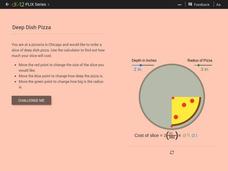
Explore the volume of solids with a real-life connection. Learners calculate the volume of a deep-dish slice of pizza to determine its price. They model the slice as a part of a cylinder and create a formula for calculating the cost.
Curated OER
Graphing Linear Equations
Ninth graders review the information that they have already learned
with regard to linear equations and graphical representations. They then assist in combining equations with a graphical element and complete various graphs with this...
Curated OER
The Yo-Yo Problem: Solving Linear Equations
Learners write the algebraic equation to determine the number of weeks money must be saved to purchase a yo-yo. In this algebra lesson, students create a pattern of one penny surrounded by six pennies. They continue the pattern and...
Curated OER
Linear Motion
In this fantastic physics and math lesson, student pairs create a ramp that will transport a rolling marble in order to learn about linear motion. Students use cardboard, straws, toothpicks, marshmallows, and paper clips in order to make...
Curated OER
How Dense is Salt Water?
Young schoolers explore the concept of linear regression. They determine the mass and density of salt water. Pupils add salt to water and record the density as salinity increases, and perform a linear regression on the data to model the...
Curated OER
Using Data Analysis to Review Linear Functions
Using either data provided or data that has been collected, young mathematicians graph linear functions to best fit their scatterplot. They also analyze their data and make predicitons based on the data. This lesson is intended as a...
PBL Pathways
College Costs 2
What is the financial benefit for attending a community college for the first two years before transferring to a four-year college? The second part of the educational lesson asks young scholars to explore this question through data...
Curated OER
Three Methods for Using Quadratic Functions to Model Data
In this modeling data worksheet, students use quadratic functions to model data using three different methods. This worksheet provides explanations and an example. Additionally, students are given the steps to find the...
PBL Pathways
College Costs
Predict the year that college costs will double in your state using linear modeling. The first part of this two-part project based learning activity asks young mathematicians to use data from the College Board. They graph the data,...
BW Walch
Creating and Graphing Linear Equations in Two Variables
This detailed presentation starts with a review of using key components to graph a line. It then quickly moves into new territory of taking these important parts and teasing them out of a word problem. Special care is...
Shodor Education Foundation
Linear Function Machine
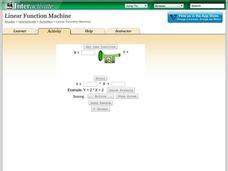
What goes in must come out! Learners play with a function machine to determine the correct function. They enter input values and watch as the machine produces the output.
CCSS Math Activities
Smarter Balanced Sample Items: High School Math – Claim 4
What is the appropriate model? Sample problems show the extent of the Smarter Balanced assessments Claim 4, Modeling and Data Analysis. Items provide pupils the opportunity to use mathematical modeling to arrive at a reasonable answer....
Illustrative Mathematics
Downhill
A car traveling down a steep hill is the model for this resource. The confusion comes when the elevation, E, is given in terms of distance, d. The distance, d, is the horizontal distance from E. Therefore, the equation, E = 7500 – 250d,...
Illustrative Mathematics
Delivering the Mail
A mail truck travels the same amount of miles per day. It will be up to your algebra learners to find an equation for this mailman’s truck. One needs a good understanding of rate of change and the initial value for this model. The...
Mathalicious
XBOX Xpotential
Touchdown! This is an exponentially insightful lesson that explores the growth of football games with different video game consoles. Class members discuss whether the increase of mergahertz can be described as linear or exponential....
Curated OER
Flipping Coins: Density as a Characteristic Property
Young scholars explore linear functions in a crime solving context. They collect and analyze data using linear equations, then interpret the slope and intercepts from a linear model.
Curated OER
US Airports, Assessment Variation
Determining relationships is all part of algebra and functions. Your mathematicians will decide the type of relationship between airports and population and translate what the slope and y-intercept represent. The problem is multiple...
Curated OER
Logistic Growth Model, Explicit Version
Via the concrete setting of estimating the population of the US, your algebra learners are introduced to a logistic growth model. Comparing and contrasting logistic, exponential, linear and quadratic models, to see which fits the data...
Curated OER
Writing Linear Equations in Different Forms
Can your class write linear equations three different ways? Here is a study guide that includes slope-intercept, standard, and point-slope forms. Learners are given the slope and a point on the line, or two points and are asked to write...
Curated OER
US Households
Learners construct and use inverse functions to model a real-world context. They use the inverse function to interpolate a data point.
Curated OER
Systems of Equations and Inequalities
This is a comprehensive lesson on creating and solving equations and systems of equations and inequalities. Problems range from basic linear equations to more complex systems of equations and inequalities based on a real-world examples....
Curated OER
Inquiry Unit: Modeling Maximums and Minimums
Young mathematicians explore the maximun area for patio with the added complexity of finding the mimimum cost for construction. First, they maximize the area of a yard given a limited amount of fence and plot width v. area on a...
Mathematics Vision Project
Module 9: Modeling Data
How many different ways can you model data? Scholars learn several in the final module in a series of nine. Learners model data with dot plots, box plots, histograms, and scatter plots. They also analyze the data based on the data...
Curated OER
Quinoa Pasta 2
Learners discover that a system of linear equations models this mixture of quinoa and corn in a collaborative task. Your learners receive all the relevant information in this second of three variants of tasks that ask them to find...


