Curated OER
The Swinging Pendulum
Students observe a pendulum and graph their observation. In this algebra lesson, students use the TI calcualtor to graph the motion the pendulum makes. They analyze the graph and make predictions.
Curated OER
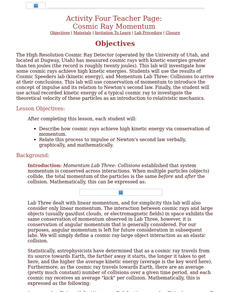
Cosmic Ray Momentum
Students describe how cosmic rays achieve high kinetic energy via conservation of momentum.
Virginia Department of Education
States of Matter
Scientists have been studying exothermic reactions before they were cool. The lesson begins with a discussion and a demonstration of heat curves. Scholars then determine the heat of fusion of ice and the heat needed to...
Texas Instruments
Vandalism 101
Learners explore logic and use Geometer’s Sketchpad and patterns of logic to solve a puzzle.
Curated OER
Worksheet 19
In this math worksheet, students use the following descriptions of a spring system to write a differential equation of the form my + γy + ky = F(x).
Curated OER
Pendulum Problems
Ninth graders explore how pendulums function. In this pendulums instructional activity students complete a pendulum lab activity.
TeachEngineering
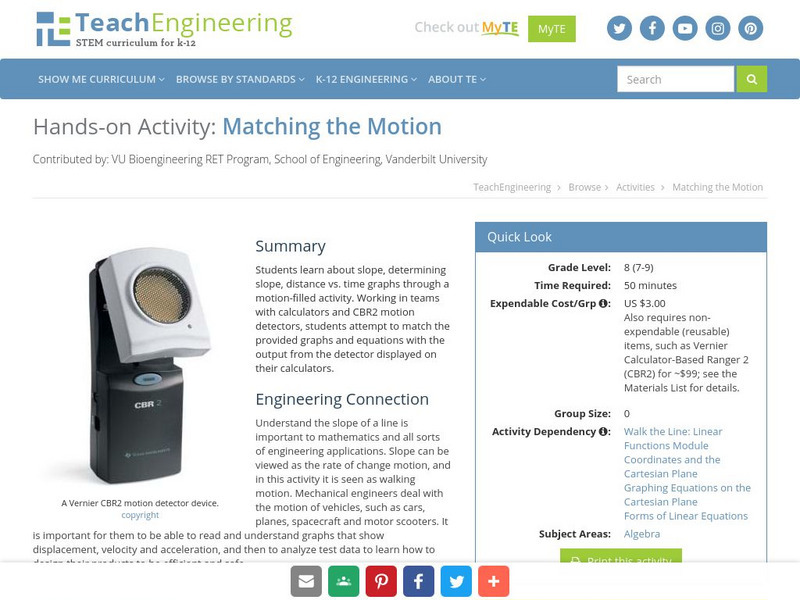
Teach Engineering: Matching the Motion
Students learn about slope, determining slope, distance vs. time graphs through a motion-filled activity. Working in teams with calculators and CBL motion detectors, students attempt to match the provided graphs and equations with the...
Concord Consortium
Concord Consortium: Stem Resources: Motion on a Ramp
Using a motion detector, students produce graphs that show the motion of a toy car as it moves on a ramp. Students collect distance versus time graphs and velocity versus time graphs as well as predict what the motion will look like on...
Physics Aviary
Physics Aviary: Graphing Motion Lab
This lab was designed to generate some data that students can use when learning about simple graphing motion. Students will track the motion of a row boat as it moves through a course and then they will create a graph of the data that...
Physics Aviary
Physics Aviary: Graphing Motion Lab 2
This lab was designed to generate some data that students can use when learning about two stage graphing motion. Students will track the motion of a dragster as it accelerates and then moves at a constant speed and then they will create...
Physics Aviary
Physics Aviary: Graphing of Motion Lab
This lab was designed to allow students to creatively play with the motion of a car and to see how the motion of the car is illustrated in graphs of position vs. time and velocity vs. time.
Physics Aviary
Physics Aviary: Graphing Motion Problem Level 2
Find the distance traveled by an object just by looking at the velocity vs. time graph.
Texas Instruments
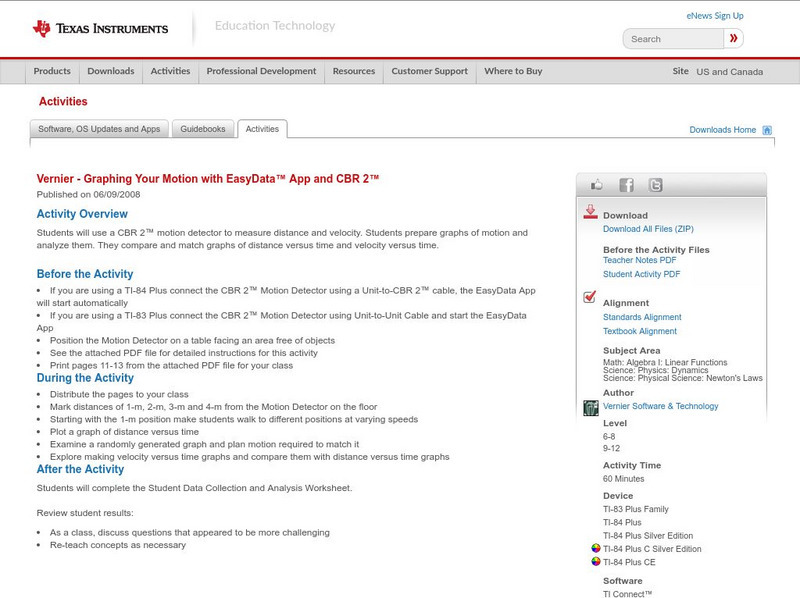
Texas Instruments: Graphing Your Motion With Easy Data App and Cbr 2
Students can use a CBR 2 motion detector to measure distance and velocity. Students prepare graphs of motion and analyze them. They compare and match graphs of distance versus time and velocity versus time.
Texas Instruments
Texas Instruments: Velocity Test: Interpreting Velocity Graphs
In this activity, students' will use a motion detector to record the distance versus time data for the simple motion of a walker. They will calculate velocity from this graph and compare it with the velocity graph generated by the...
Texas Instruments
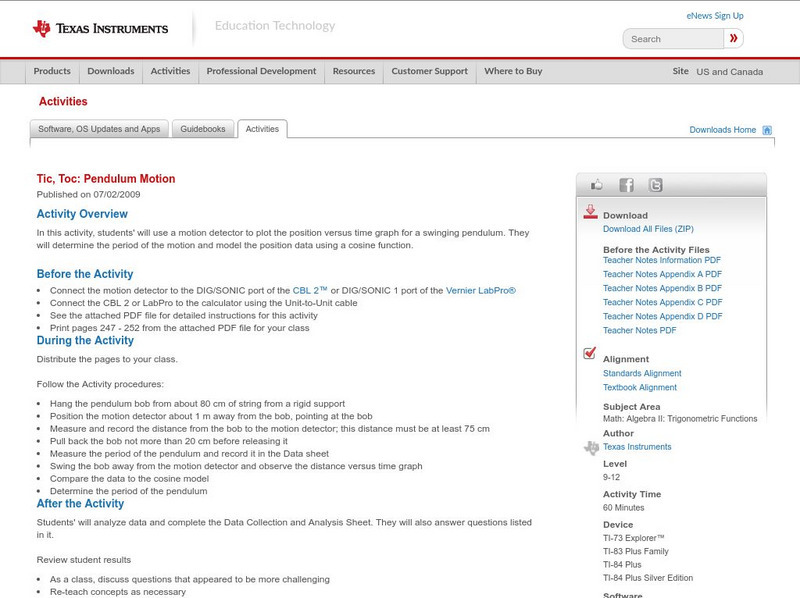
Texas Instruments: Tic, Toc: Pendulum Motion
In this activity, students' will use a motion detector to plot the position versus time graph for a swinging pendulum. They will determine the period of the motion and model the position data using a cosine function.
Texas Instruments
Texas Instruments: Walk the Line: Straight Line Distance Graphs
In this activity, students' use a motion detector to create straight-line, or constant-speed, distance versus time plots, and analyze the linear equation that describes the plots.
Physics Aviary
Physics Aviary: Graphing Motion Problem Level 1 Part 3
Find the distance traveled by an object by looking at the velocity vs. time graph. All velocities are constant.
Texas Instruments
Texas Instruments: Graph It in Pieces: Piecewise Defined Functions
In this activity, students' will record motion data for a walker and describe segments of the walker's motion using linear function. They will model the motion data using a piece-wise continuous function assembled from linear functions.
Texas Instruments
Texas Instruments: Solving a System of Linear Equations
In this activity, students' will collect and analyze motion data in order to determine the solution to a linear system of equations. They graph two motions on a common axis and find their intersection.
Concord Consortium
Concord Consortium: Stem Resources: Making Waves
Learn how to make waves! Using a motion sensor, students will recreate distance vs. time graphs given in the lab. Lab gives a detailed procedure as well as questions that can be saved online.
Texas Instruments
Texas Instruments: Tight Rope
In this activity, students examine quantities that are linearly related and can be visually represented using a straight-line graph. Students collect distance versus time data using a motion detector and find a model for the...
Texas Instruments
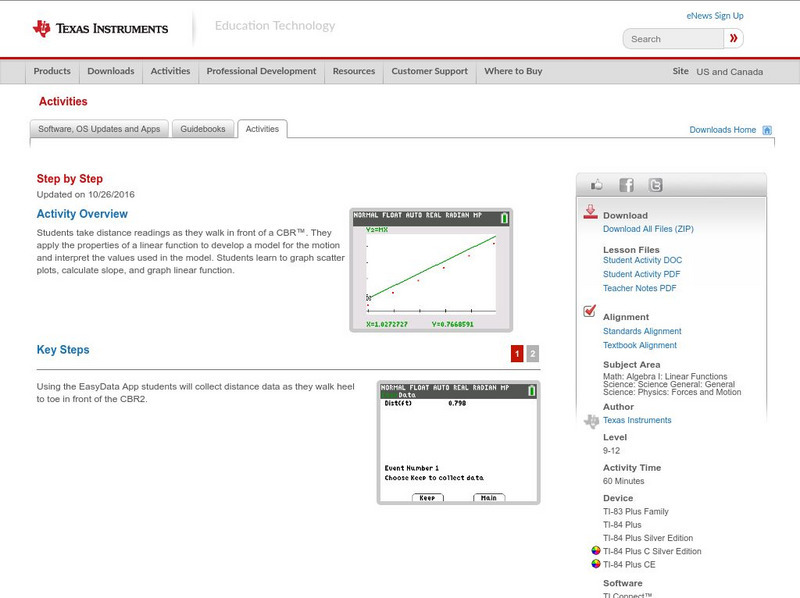
Texas Instruments: Step by Step
In this activity, students take distance readings as they walk in front of a CBR. They apply the properties of a linear function to develop a model for the motion and interpret the values used in the model. Students learn to graph...
Texas Instruments
Texas Instruments: A Steep Hike Adventure 3
Students use the CBR 2 to gather distance and time data for various walking speeds. They observe the effect of change in direction and speed of motion on distance versus time graphs. Students interpret and analyze graphs, calculate slope...
Texas Instruments
Texas Instruments: A Tall Story
In this activity, students can use the motion detector to measure their current height and obtain a mean value. They will use this and earlier data to plot a graph of height versus age. Students will identify the mathematical model that...

