Texas Instruments
Finding Linear Models Part III
Explore linear functions! In this Algebra I lesson, mathematicians graph data in a scatter plot and use a graphing calculator to find a linear regression and/or a median-median line. They use the model to make predictions.
EngageNY
Modeling a Context from Data (part 2)
Forgive me, I regress. Building upon previous modeling activities, the class examines models using the regression function on a graphing calculator. They use the modeling process to interpret the context and to make predictions...
Curated OER
Linear Regression on TI-83
In this linear regression instructional activity, students use TI-83 calculators to graph linear regressions. Instructions for using the calculator are provided. This two-page instructional activity contains six problems.
Curated OER
Linear Regression on TI-89
For this linear regression worksheet, students use the TI-89 calculator to graph linear regressions. Details instructions on the use of the calculator are provided. This one-page worksheet contains six problems.
Curated OER
Linear Regression on TI-86
In this linear regression activity, students solve linear regression problems using the TI-86 calculator. Detailed instructions on how to use the calculator are provided. This one-page activity contains seven problems.
Curated OER
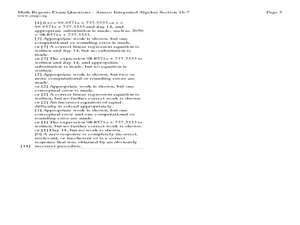
Fourteen Math Regent Exam Statistics Questions on Scatter Plots and Linear Regression
For this linear regression worksheet, students solve fourteen Math Regent Exam questions regarding scatter plots and linear regression. The solutions are provided.
Curated OER
Practice Problems: Correlation and Linear Regression
In this correlation and linear regression activity, learners examine data to determine the statistic mean. They compute the percent of the variability. This three-page activity contains 16 problems. Answers provided.
Curated OER
Linear Regression on TI-85
In this linear regression worksheet, students use TI-85 calculators to complete linear regression expressions. Detailed instructions on the use of the calculator are provided. This one-page worksheet contains seven problems.
Curated OER
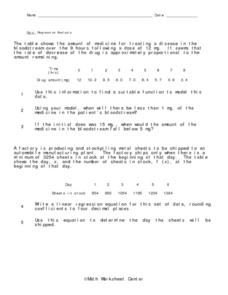
Regression Analysis
In this regression analysis learning exercise, 9th graders solve 10 different word problems related to regression analysis. First, they use the information given to find a suitable function to model the data. Then, students use the model...
Curated OER
Making Predictions from Data with a Graphing Calculator
In this making predictions from data worksheet, students solve 15 short answer problems. Students determine average miles per gallon given data on miles traveled and gas used. Students make predictions using the data and a line of best fit.
Flipped Math
Correlation
Determine how close the line is to the scatter plot. Clear video instruction shows how to plot a scatter plot and find the best fit line using the linear regression function on a calculator. Pupils use the information from the calculator...
Curated OER
Linear Regression on TI-82
In this linear regression worksheet, students graph linear regression problems using the TI-82 calculator. Instructions for using the calculator are provided. This two-page worksheet contains six problems.
Flipped Math
Unit 5 Review: Bivariate Data
The data says it's a wrap. Pupils work through four review questions with multiple parts dealing with bivariate data. Questions cover creating and interpreting two-way tables and scatter plots with lines of best fit. Scholars finish up...
Statistics Education Web
Text Messaging is Time Consuming! What Gives?
The more you text, the less you study. Have classes test this hypothesis or another question related to text messages. Using real data, learners use technology to create a scatter plot and calculate a regression line. They create a dot...
CCSS Math Activities
Social Security Trust Fund
Will Social Security still be around when you retire? Given data on the predicted balance of the social security fund over time, scholars plot the points on a coordinate grid and determine if a quadratic regression fits the data. They...
Teach Engineering
Can You Resist This?
Some things are hard to resist. Small collaborative groups build circuits and calculate the voltage using Ohm's Law. Budding engineers explore the connection between the voltage across different resistors and linear...
Virginia Department of Education
Linear Modeling
An inquiry-based algebra lesson explores real-world applications of linear functions. Scholars investigate four different situations that can be modeled by linear functions, identifying the rate of change, as well as the...
Statistics Education Web
The United States of Obesity
Mississippi has both the highest obesity and poverty rate in the US. Does the rest of the data show a correlation between the poverty and obesity rate in a state? Learners tackle this question as they practice their skills of regression....
Statistics Education Web
NFL Quarterback Salaries
Use statistics to decide if NFL quarterbacks earn their salaries! Learners study correlation coefficients after using technology to calculate regression equations. Through the data, they learn the meaning of correlation and correlation...
Curated OER
Lesson 6-7: Scatter Plots and Equations of Lines
In this scatter plot worksheet, students examine tables and write a linear equation that matches the table. Students graph linear equations. They read scatter plots, determine the trend line, and write a linear equation to...
Virginia Department of Education
Logarithmic Modeling
Explore logarithms and logarithmic regression. Young mathematicians first learn about inverse functions and about the logarithm function family. They take their newfound knowledge to use logarithmic functions to model situations and...
EngageNY
Modeling Relationships with a Line
What linear equation will fit this data, and how close is it? Through discussion and partner work, young mathematicians learn the procedure to determine a regression line in order to make predictions from the data.
Curated OER
Linear Systems: Least Square Regression
In this least square regression worksheet, students find solutions to given linear systems. They draw pictures, draw a vector and prove the solution. This two-page worksheet contains eleven problems, with some examples and explanations.
Curated OER
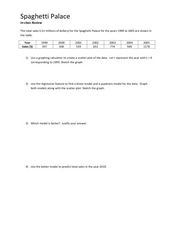
Spaghetti Palace
In this spaghetti palace worksheet sheet, learners examine data and create a scatter plot. They use their graphing calculator to find a linear model and a quadratic model for given information. Students predict total...


