Curated OER
Statistics - Central Tendency
In this statistics worksheet, students solve and complete 13 different problems that include creating various box-and-whisker plots. First, they write a definition for mean, median, mode and range. Then students explain how to determine...
National Wildlife Federation
Citizen Science to the Rescue!
You don't have to be a scientist or even out of high school to contribute to scientific research. In the 12th lesson plan in the series of 21, scholars use this opportunity to add to the growing body of scientific knowledge and consider...
Curated OER
Surface Meteorological Observation System (SMOS)
Young scholars investigate local surface weather conditions. They log weather conditions for thirty days, develop a graph, plot cloud cover, and compare/contrast the graphed lines of various weather factors.
Curated OER
How Wet Did It Get?
Students measure the rainfall/snowfall on the playground on a rainy/snowy day with a rain/snow gauge. They draw a bar graph representing the amount of water that fell and observe a satellite image of the clouds and local weather system...
Curated OER
The Fabled Maine Winter
Students graph and analyze scientific data. In this research lesson students use the Internet to obtain data then draw conclusions about what they found.
Curated OER
Surface Meteorological Observation System (SMOS)
Students monitor local surface weather conditions for at least 30 days. They interpret the data by graphing it and detemining percentages.
Curated OER
Highs and Lows
Students use email to chart weather patterns and then graph their findings. In this weather patterns lesson, students chart their weather for a week at the school. Students then use email to find temperatures at a variety of locations....
Curated OER
Predicting Temperature: An Internet/Excel Learning Experience
Third graders use the Internet (www.weather.com) to find the high temperature for our locale and the high temperature for another city around the world. They keep track of the temperature in these two locations for 10 days.
Curated OER
El Nino Lesson
Young scholars compare graphs of weather occurrences. In this environmental lesson plan, students will being using the website to gather weather related information for a certain time period. The young scholars will then graph the data...
Curated OER
Agriculture, Weather, Economy and Indiana
Fourth graders, in groups, investigate the role of weather in Indiana's farming economy. They make a prediction as to weather and its effect on the economy of Indiana. They present their data using a media presentation of data...
Curated OER
Make Your Own "Weather" Map
Students create their own "weather" map using data from x-ray sources. They analyze and discuss why it is important to organize data in a fashion in which is easy to read. They compare and contrast different x-ray sources using a stellar...
Curated OER
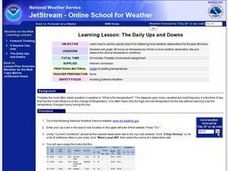
Learning Lesson: Ups and Downs
Students use the internet to find the air temperatures in their area. They create a graph based on the data. They analyze the data and examine tips for avoiding extreme weather.
Curated OER
Weather Variables Lab
Students examine what happens when air temperature drops and gets closer to the dewpoint. They perform a lab activity which illustrates the effects on humidity, precipitation and barometric air pressure.
Curated OER
Rainforest Unit
Students investigate the Rainforest. In this Rainforest lesson, students research magazines, journals and the Internet to create a "Save the Rainforest" slogan. Students will record local rainfall amounts and create a graph comparing...
Curated OER
CURRENT AND CLIMATE
Students study currents and how they have been used to plot courses for travel. They examine the ocean currents in both the Atlantic and Pacific and discuss their effect on local weather.
Curated OER
Make Your Own "Weather" Map
Students develop and apply a variety of strategies to solve problems, with an emphasis on multi-step and non-routine problems. They acquire confidence in using mathematics meaningfully.
Texas State Energy Conservation Office
Investigation: Blowing in the Wind
Using a simulated air sample, environmental or earth science pupils examine the components. You will need to prepare the faux air by using a hole punch and various colors of construction paper. Each color will represent a different...
Curated OER
Historical Temperatures
Young scholars research historical regional temperatures for their current season. In this historical weather lesson, students conduct weather station and Internet research to learn about historical regional temperatures. Young scholars...
Curated OER
Dimming the Sun
Students collect, interpret and analyze weather variable data. They describe atmospheric variables that affect evaporation. Students create graphs and analyze the information collected.
Curated OER
The Newspaper
In this journalism worksheet, students use a copy of their local newspaper to complete this page. Students answer questions about the publisher and staff of the paper, the weather, TV programming, comics and classified sections. There...
Curated OER
Temperature High and Lows
Students gather high and low temperature readings through email. In this temperature graphing lesson, students use a spreadsheet to input data for a graph. students interpret the graphs to compare and contrast the data from different...
Curated OER
I Can't Take the Pressure!
Students explore the concept of air pressure. Using candy or cookie wafers to model how air pressure changes with altitude, they conduct an aluminum can crushing experiment, compare the magnitude to gravitational force per unit area,...
Curated OER
Guetemala's Changing Forest
Eighth graders compare their local ecological zone to the tropical rainforest. In this natural ecology lesson, 8th graders complete an activity about the differences in ecological zones. They compare their biome to the Guatemalan...
Curated OER
Climate Systems - Which Location Is Best For Me?
Students study the difference between weather and climate. In this climate systems lesson plan students search the Internet for the parts of the Earth's system, gather climate data and complete a challenge scenario.


