Hi, what do you want to do?
Curated OER
Representing Data 2: Using Box Plots
What information can be gleaned from a box and whiskers plot? Discuss the five summary values - minimum, maximum, upper and lower quartiles, and median - and what conclusions can be made from these values? Included here is a matching...
Curated OER
Box Plots on the TI-83 Calculator
Eighth graders research box plots on the Internet. They gather real life statistics and analyze the collected statistics by making multiple box plots on the TI-83 calculator.
Curated OER
How's The Weather?
Students make a box and whiskers plot using the TI-73 graphing calculator. Each student would have their own calculator but they would work in small groups of two or three to help each other enter the data and make the plots.
Curated OER
Frequency Tables
Seventh graders construct frequency tables and box-and-whisker plots. After constructing tables and plots, they take a quiz on mean, median, mode, range, scientific notation, and number properties.
Curated OER
Estimating the Mile Record
In this estimating the mile record, learners examine given data. They use create a box-and-whisker plot to determine the upper and lower quartiles of the data. This one-page worksheet contains 1 multi-step problems.
Curated OER
Finding a Line of Best Fit
Pupils engage in the practice of creating a scatter plot with the data obtained from measuring different resting heart rates. The data is used to create the table that is translated into a graph. The lesson gives instructions for the use...
Oswego City School District
Regents Exam Prep Center: Statistics: Percentiles and Quartiles
Use this site to learn how to divide data into quartiles in this tutorial. You'll need a calculator to do the practice problems. The teacher resource page contains a warm-up exercise for use before a quartile lesson.
Varsity Tutors
Varsity Tutors: Hotmath: Algebra Review: Box and Whisker Plots
Find a quick, concise explanation of a Box-and-Whisker Plot. An example is given and clearly explained.
ClassFlow
Class Flow: Box and Whiskers Plot
[Free Registration/Login Required] This is an interactive flipchart for ordering the steps for plotting a box and whiskers. It also allows students to determine the minimum, maximum, median, upper and lower quartiles. Students will also...
Other
Nmu: Box and Whisker Plot Instructions
Site discusses the use of box-and-whisker plots. An example is presented and completely worked through, so that the user can see the results of the calculations after the steps have been explained.
Shodor Education Foundation
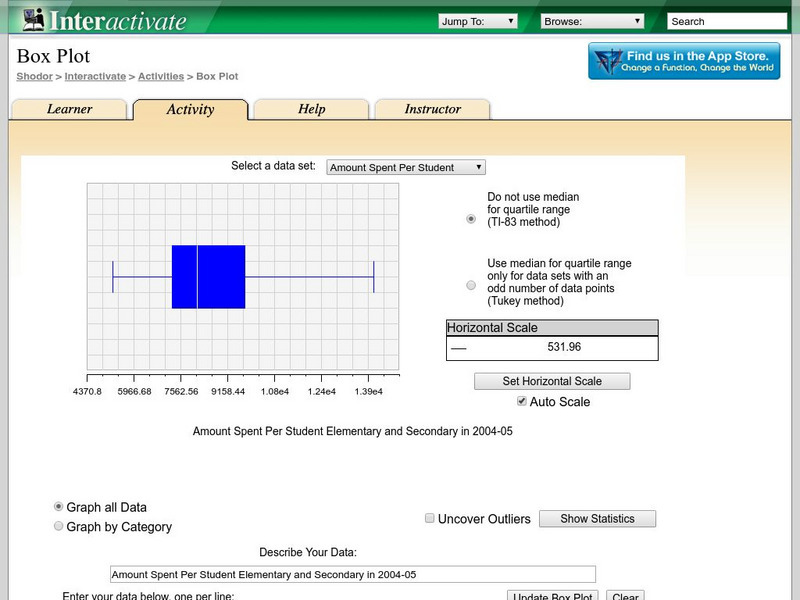
Shodor Interactivate: Box Plot
Students learn about box-and-whisker plots. The interactive box plot allows the user to explore maximum, minimum, median, upper quartile, lower quartile, and outliers.
Other
College of Natural Sciences: Measures of Location
Different measures of location are discussed in terms of box and whisker plots.
McGraw Hill
Mc Graw Hill Education: Glencoe: Measures of Variation
Lesson examples that review how to calculate measures of variation such as range and outliers.


