Curated OER
Relating Distance and Velocity Over Time
Students calculate the distance and velocity over time. In this algebra lesson, students graph a linear function to represent the distance vers time travel. They interpret their graphs and draw conclusion.
Curated OER
How Much Will I Spend On Gas?
Students construct a linear graph. In this graphing lesson, students determine a monthly budget for gasoline. Students construct a t-chart and coordinate graph to display data. Resources are provided.
Curated OER
Problem-Solving Application: Use a Graph
In this problem solving worksheet, 6th graders use the problem solving steps of understand, plan, solve and look back to answer a graphing question.
Curated OER
Sonar Mapping
Students use a shoe box to create a seafloor model and use cardboard for layering inside of the shoe box to simulate the ocean floor. They probe the ocean floor to simulate sonar echoes. Finally, students graph their data to get a...
Curated OER
Analyzing Cubes
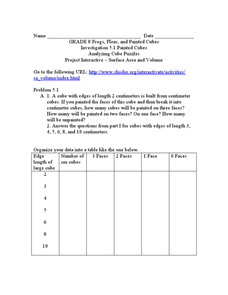
In this analyzing cubes worksheet, 9th graders solve and complete 6 different types of problems. First, they organize the given data into the table provided. Then, students study the patterns in the table and tell whether the pattern of...
Curated OER
Centripetal Force
Students experiment to show the components that dictate centripetal force in an object. They observe how the object moves in a circular path around a central point.
Curated OER
Linear Patterns in Data
Eighth graders extend their learning of graphing linear equations and are introduced to connecting patterns in tables and graphs to represent algebraic representations. They then determine patterns and extrapolate information from these...
Curated OER
Unit 5: Worksheet 4 - Proportions
For this proportion worksheet, learners use proportions to find the missing side of similar triangles, they identify the percent of a number, and graph points on a coordinate plane. Students solve real life story problems dealing with...
Curated OER
Spaghetti Bridges
Students thread a piece of spaghetti through the holes in the cup. One person suspend the cup by placing each index finger approximately one inch in from the ends of the spaghetti.
Curated OER
Spaghetti Bridges
Eighth graders experiment with building bridges of spaghetti, pennies, and a cup to determine how varying the number of spagetti pieces affects the strength of the bridge. They graph their results and interpret the data.
Curated OER
Art as Storyteller
Learners examine how paintings tell stories. They read biographies about artists, analyze paintings, research and write the art history of a painting, write a creative story based on the painting, and create a painting in the artist's...
Curated OER
Follow That Ship!
Students in this exercise are introduced to the distinct ways of measuring distance (nautical miles) and speed (knots) at sea, as well as the concepts of latitude and longitude for establishing location.
Curated OER
Evaluating Data
In this data activity, students learn how to organize the data collected during an experiment and practice finding patterns. Students graph a table of experimental data and complete 1 short answer question.
Curated OER
Risky Business
High schoolers view a video on AIDS, HIV and the ways in which HIV is spread. They discuss ways to avoid contracting HIV and participate in a simulation that shows the growth of a communicable disease.
Curated OER
Graphing Linear Equations
Learners graph linear equations. In this algebra lesson plan, students investigate the price of tolls in different states and create a graph. They analyze their graph and draw conclusions.
Curated OER
Science 911: Car Crash Testing
Learners explore, experiment and analyze the concept of using dummies in a car crash test. They collaborate in a series of tests designed to simulate what really happens in a two-car collision. Each student incorporates probability,...
Curated OER
How Creepy!
Pupils observe and measure a model of slow down slope movement. In this graphing lesson students collect, record, and organize data that apply to models.
Curated OER
Slope Fields and Euler's Method
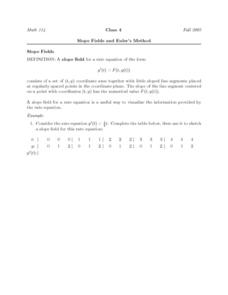
In this slope field worksheet, students use a slope field for a rate equation. Using Euler's Method, they identify the piecewise linear function approximating the solution of the initial value problem. This four-page worksheet contains...
Curated OER
A Statistical Look at Jewish History
Students complete their examination over the Jewish Diaspora. Using population figures, they discover the importance of percentages in exploring trends. They use their own ethnic group and determine how it is represented in the United...
Curated OER
ou are the Researcher!
Students conduct a census at school. They collect data, tally it, and create a frequency table. Students display their data in three different types of graphs. They write complete sentences describing the graph.
Curated OER
Baltimoreans in the California Gold Rush
Eleventh graders explore the reasons for migration to California during the Gold Rush. In this American History instructional activity, 11th graders read letters about the opportunities and obstacles people faced. Students...
Curated OER
Globe Lesson 9 - Around the World - Grade 6+
In this geography skills learning exercise, students read 5-travel scenarios and use their problem solving skills to respond to 9 short answer questions.
Curated OER
Could You Repeat That?
Pupils participate in an oral story telling activity designed to show how story embellishments occur. They read "Beowulf" and identify incongruities that suggest additions and embellishments over the years.
Curated OER
Conductivity of salt Solutions
Learners investigate the concentration level of solutions. In this math/science instructional activity, students identify three different ionic compounds. They predict the conductivity of each using their collected data.


