Hi, what do you want to do?
TeachEngineering
Teach Engineering: Scaling the Map
Students learn how to determine map distances and areas using the map scale. They get a feel for how much an area represents on the map in relation to the size they are suggesting for their underground caverns to shelter the Alabraska...
Houghton Mifflin Harcourt
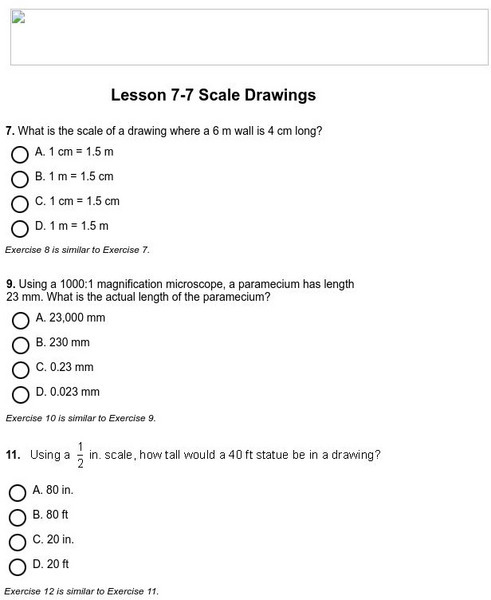
Holt, Rinehart and Winston: Homework Help Independent Practice: Scale Drawings
Get independent practice working with scale drawings. Each incorrect response gets a text box explanation and another try. Correct responses are confirmed.
Science Education Resource Center at Carleton College
Serc: Mapping Your World
This activity serves as an introduction to mapping skills and the classroom. Young scholars will create a map of the classroom, analyze and determine qualities that make a clear, concise map, then create a database of qualities they will...
American Geosciences Institute
American Geosciences Institute: Earth Science Week: Houston Activity: Texas Rocks
Using a geologic time scale and map students investigate the rocks in their area.
National Association of Geoscience Teachers
Nagt: Bringing the Geologic Time Scale Down to Earth in the Students' Backyard
This activity is specifically designed for a field trip to Drayton Hall, which is a historic plantation near Charleston, South Carolina. It does provide a model of how a similar activity could be designed for a local area, and there are...
Science Education Resource Center at Carleton College
Serc: Map and Compass Lab
Science Scope article presents an activity on topography and land masses that helps students learn about scientific inquiry. Students also practice making and interpreting scale drawings and learning about computation, estimation and new...
TeachEngineering
Teach Engineering: Hurricane! Saving Lives With Reasoning & Computer Science
Students develop and apply the distance formula and an x-y coordinate plane on a hurricane tracking map, and then use a map scale to determine distance in miles. Then, using MATLAB computer science programming language, students help...
Curated OER
Educational Technology Clearinghouse: Maps Etc: Economic Activity in India, 1915
A map from 1915 of British India, showing principal economic products of the region at the time. The map is color-coded to show areas where tea, wheat, rice, opium, tobacco, jute, and cotton are grown, and areas of coal extraction....
National Earth Science Teachers Association
Windows to the Universe: Changing Planet: Melting Glaciers
Students sort photographs of glaciers and measure glacial retreat to observe how alpine glaciers have retreated over the past century. Includes a printable worksheet, links to relevant materials, and extension activities.
TeachEngineering
Teach Engineering: Robotic Perimeter
Students learn and practice how to find the perimeter of a polygonal shape. Using a ruler, they measure model rooms made of construction paper walls. They learn about other tools, such as a robot, that can help them take measurements....
Science Education Resource Center at Carleton College
Serc: My Geologic Address: Locating Oneself in Geologic Time and Process
Students find a local location on a series of geologic maps (local,regional,and global) working from small to large scale. Map keys and map features are consulted in order to compose a "geologic address" from the most specific to the...
TeachEngineering
Teach Engineering: Possible Locations
Students use their knowledge of scales and areas to determine the best locations in Alabraska for the underground caverns. They cut out rectangular paper pieces to represent caverns to scale with the maps and place the cut-outs on the...


