Curated OER
Chart Making for Navigators
Students discuss the importance and function of nautical maps for sailors. They, in groups, take soundings of a simulated bay in a shoebox and develop a nautical chart that enable them to navigate the shoebox safely.
Curated OER
Storm Clouds-- Fly over a Late Winter Storm onboard a NASA Earth Observing Satellite
Students study cloud data and weather maps to explore cloud activity. In this cloud data lesson plan students locate latitude and longitude coordinates and determine cloud cover percentages.
Curated OER
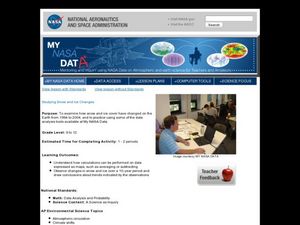
Studying Snow and Ice Changes
Students compare the change in snow and ice over a 10 year period. In this environmental science lesson, students use the live data on the NASA site to study and compare the monthly snow and ice amounts on a map of the entire...
Curated OER
Exploring an Atlas
Students explore global geography by participating in an atlas activity. In this countries of the world lesson, students collaborate in small groups and analyze an atlas while researching continents, countries and demographics. Students...
Curated OER
Water
Students complete activities to examine the properties of water. In this water science lesson, students read a book about water's forms and study a map or globe of the Earth to investigate water. Students discuss living things that need...
Curated OER
NIGHT AND DAY: DAILY CYCLES IN SOLAR RADIATION
Students examine how Earth's rotation causes daily cycles in solar energy using a microset of satellite data to investigate the Earth's daily radiation budget and locating map locations using latitude and longitude coordinates.
Curated OER
Lost at Sea: The Search for Longitude
Students research and chart the shortest course to circumnavigate the globe.
Curated OER
COLD SEA WATERS
Students examine how old sea waters affected the local and state area during the summer of 1998. Studying a detailed web-site helps students examine sea temperatures.
Curated OER
Volcanic Activity in the U.S.
Students locate and map ten volcanoes in United States, create chart comparing volcanoes by last eruption, type of volcano, location, and interesting fact, and create Powerpoint slide show describing basic
information about volcanoes and...
Curated OER
Wolves: Friend or Foe?
High schoolers study wolves and their habitat in Yellowstone. In this environment and behavior lesson students create an interactive map of wolves in Yellowstone.
Curated OER
Home: the Story of Maine "A Love for the Land": Where Are You? Who Are You?
Students investigate their neighborhood both as it is now and as it was 100 years ago. They take a walk around their neighborhood and fill out a worksheet before completing a worksheet.
Curated OER
Comparison of Snow Cover on Different Continents
Pupils use the Live Access Server (LAS) to form maps and a numerical text file of snow cover for each continent on a particular date. They analyze the data for each map and corresponding text file to determine an estimate of snow cover...
Curated OER
Snow Cover By Latitude
Students create graphs comparing the amount of snow cover along selected latitudes using data sets from a NASA website. They create a spreadsheet and a bar graph on the computer, and analyze the data.
Curated OER
Earth Matters
Students identify Earth's equator, prime meridian, lines of latitude, lines of longitude, parallels, and meridians.
Curated OER
Snow Cover By Latitude
Students examine computerized data maps in order to create graphs of the amount of snowfall found at certain latitudes by date. Then they compare the graphs and the data they represent. Students present an analysis of the graphs.
Curated OER
Monarch Butterflies
First graders listen to books about butterflies and look at pictures of butterflies. Students review the stages of butterflies and learn the migratory path the monarch takes in its adult stage.
Curated OER
Monarch Butterflies
First graders identify monarch butterflies and study their life cycles. They order the stages of the life cycle and create a monarch butterfly of construction paper. This well-designed activity should be easy to implement in your classroom.
Curated OER
The Mysteries of El Nino: How Much do We Really Know?
Seventh graders investigate the causes and effects of El Nino and explore its global impact on weather related occurrences through this series of activities.
Curated OER
Scientist Tracking Network
Young scholars correlate surface radiation with mean surface temperature of several geographic regions. They observe how these parameters change with latitude and construct an understanding of the relationship of solar radiation to...
Curated OER
Using Vegetation, Precipitation, and Surface Temperature to Study Climate Zones
Students begin their examination of the climate zones found around the world. Using a software program, they identify the relationship between the vegetation, climate and temperatures of the different zones. They also plot coordinates...
Curated OER
A Comparison of Cloud Coverage Over Africa
Students use a NASA satellite data to contrast amounts of cloud coverage over different climate regions in Africa. They explore how Earth's major air circulations affect global weather patterns, and relate to local weather patterns.
Curated OER
Radiation Comparison Before and After 9-11
Using the NASA website, class members try to determine if changes could be detected in cloud cover, temperature, and/or radiation measurements due to the lack of contrails that resulted from the halt in air traffic after the attacks...
Curated OER
Plate Tectonics Day 3 Sea Floor Spreading: Evidence for Continental Drift
Learners are introduced to Sea Floor Spreading and how it provides evidence for Hess's and Deitz's theory of Continental Drift. They use paleomagnetic data to calculate the rate of Sea Floor Spreading.
Curated OER
Seasons and Cloud Cover, Are They Related?
Students use NASA satellite data to see cloud cover over Africa. In this seasons lesson students access data and import it into Excel.


