Curated OER
Marginal Cost Curve Worksheet
In this economics worksheet, students use their problem solving skills to respond to 16 questions about marginal costs and levels of production.
Council for Economic Education
Production Possibilities Curve
Demonstrate the important economic principles of the production possibilities curve, including how to calculate opportunity cost and graph curves by using a table or calculation. Learners use a variety of methods, including videos,...
Curated OER
Anything Worth Doing Is Not Necessarily Worth Doing Well
Provide your class with information on basic economic concepts using this resource. Learners read background
information, examine a graph, and answer seven questions about marginal benefits and costs.
Curated OER
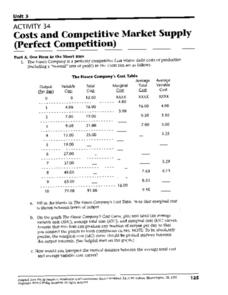
Costs and Competitive Market Supply
For this economics worksheet, students are presented with tables and diagrams for a fictitious company, then must answer questions, solve problems, plot and label graphs, and make predictions based on information provided.
Curated OER
Chapter 21: Consumer Behavior and Utility Maximization
Who knows why consumers act the way they do? After viewing this presentation, your class will - and they will also know how to optimize consumer behavior. Prepare your young captains of industry for their place in the world of business...
Curated OER
Pure Monopoly
In this Pure Monopoly worksheet, students complete a table and graphs, make calculations and predictions, and answer several questions in short answers.
Miami University
Chapter Nine Worksheet: Monopoly
Advanced economics pupils analyze a series of graphs, data sets, and profit scenarios all related to monopolies and marginal revenue. They read through the background information, complete a graph using the data provided, and justify...
Curated OER
Why Do Gasoline Prices React to Things That Have Not Happened?
Students investigate how the price of gas is determined. In this economics instructional activity, students analyze supply and demand and seasonal demand, create tables and graphs and reflect on consumer expectations.
Curated OER
Chapter 3: Individual Markets, Demand & Supply
Supply and demand, one of the most fundamental topics in economics, is the focus of this presentation. Cascading through detailed graphs and defining the law of demand, as well as the demand and supply schedules, this slideshow is sure...
Curated OER
Reaganomics: A fix to the unemployment and inflation of the time
The 1980's was an interesting time for the American economic system. This presentation relates the lead to and the effects of Reaganomics, Trickle down economy, and Clintonomics. Embedded links, works cited, and images are included. A...
Curated OER
Marketing Occupations
Students identify and explain the variables effecting supply and demand in the marketing industry. Then they define the terms supply and demand and graph supply and demand curves on a standard grid. Students also formulate what happens...
Curated OER
Market Structures and Competition
Students review concepts related to market structures and competition. Using supply and demand, they identify what factors cause them to shift and analyze business downward facing demand curves. They compare and contrast the abilities of...
Curated OER
Microeconomics Summary
Twelfth graders study microeconomics. In this Economics lesson, 12th graders draw graphs on government taxes. Students decide if these graphs are true or false.
Curated OER
Demand and Supply Worksheet
In this economics worksheet, students use their problem solving skills to respond to 28 questions regarding demand and supply.


