Curated OER
Using Standard Deviation, part 2
High schoolers explain and learn the practical application of standard deviation. They compare cities in the U.S. and discover whether cities closer to the ocean have more consistent temperatures. Useful resources are given.
Curated OER
Rising and Falling Fractions
Students explore outcomes from the conversion of fractions to decimals in stock market quotes and explore fluctuating interest rates using an amortization calculator.
Curated OER
Geo Jammin' By DeSign - Day 3, Lesson 15: The Quiltmaker's Gift
Students listen to a read aloud of The Quiltmaker's Gift by Jeff Brumbeau finding examples of symmetry in the illustrations in the book.
Curated OER
Telling Time to 5 Minutes
Students take part in various activities ranging from creating a human clock, to small group problem solving to reinforce the concept of telling time accurately to five minutes on an analog clock.
Curated OER
Water in the Texas Coastal Basins
Learners, after researching a Texas coastal basin, map and graph the information they collect and then translate it into a short report to be presented to their classmates. They brainstorm unique ways to maintain Texas estuaries as well...
Curated OER
Fractions to Percent
In this fraction instructional activity, 6th graders change fractions to percent. Students complete 10 matching questions connecting the given fraction to its correct percentage amount.
Curated OER
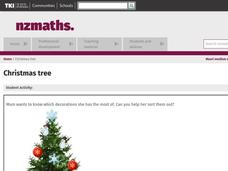
Christmas Tree
Ask the students for ideas on sorting the decorations so that they could tell someone what was in the box. Students share idea for sorting a box of Christmas decorations so that they could tell someone what was in the box. They share...
Curated OER
All About Shoes
Students sort shoes. In this sorting lesson, students use shoes to explore attributes and practice sorting. This lesson encourages the use of a Venn Diagram to aide in student sorting.
Curated OER
Sensational Seasons
Second graders explore how seasonal weather patterns affect temperature and their lives.
Curated OER
Moooooove into Graphing
First graders explore graphing software and create their own graph of farm animals. Then students analyze their graph using the teacher made worksheet which is imbedded in this lesson plan. Great lesson plan!
Curated OER
Dino Hunt
Students use the Internet to gather information about dinosaurs. They practice navagating through the different websites. They also practice listening to directions and also explore how to fill out a KWL chart.
Curated OER
Wonderful, Wild Weather
Students study the different types of weather, how it affect what they wear, and how it is related to the seasons. They compare the seasons and tell how they prepare for the change in seasons. They design a creative presentation about...
Curated OER
Exploring Phases of Matter
Students discuss and experiment with the phases of water. In this phases of matter lesson plan, students recognize the different states of matter. Students measure and record changes and understand when the state changes.
Curated OER
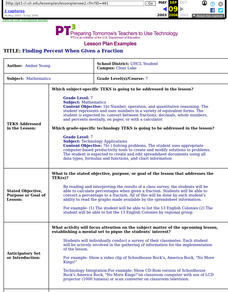
Finding Percent When Given A Fraction
Seventh graders calculate percentages when given a fraction. They convert a percentage to a fraction. All of this be done by each student's ability to read the graphs made available by the spreadsheet information.
Curated OER
SOS: Save Our Ski Slopes
Students defend downhill skiing as an Olympic Games event by creating a presentation that graphically proves the economic impact and popularity of this event.
Curated OER
What Does Percent Have to Do With It?
Fourth graders go shopping for a real life experience involving percent. They explore the concepts of sales tax and discount prices.
Curated OER
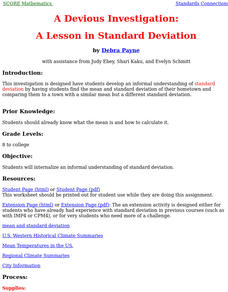
A Lesson In Standard Deviation
Students develop an informal understanding of standard deviation by having students find the mean and standard deviation of their hometown and comparing them to a town with a similar mean but a different standard deviation.
Curated OER
The Lake Effect
Fourth graders conduct an experiment demonstrating the effects of water and air temperature on precipitation. They create graphs demonstrating their findings using Claris Works for Kids.
Curated OER
The Ice Cream Shop
Second graders read books about ice cream and plan an ice cream sundae party for the class. They research ingredients and determine how much the party cost each student. They hold a mock opening for an ice cream store and have their party.
Curated OER
Catch a Dream
Students apply the concepts of air pressure, the Bernoulli Effect, and angle of attack to build their own model planes out of paper, plastic, wooden rods, and drinking straws.
Curated OER
Mapping with a Compass: A Simulated Survey
Students use compasses and grids to map the locations of artifacts found in a simulated dig site. In groups, they role-play as future archeologists excavating a school site. Groups begin at their assigned datum and site the artifacts...
Curated OER
Let's Cook
Students practice converting measurements into metrics. In groups, they translate a recipe from English into German and convert all measurements into metrics for the recipe. They examine the difference between United States and metric...
Curated OER
Favorite Foods at Thanksgiving
Fourth graders study different types of graphs as a means of displaying information. They survey others to find their favorite Thanksgiving food and then graph the results using different types of graphs.


