Curated OER
Velocity
Students explore the concepts of velocity, acceleration, distance and football. They collect data on the velocity of a football and they determine the distance and height of a football when it is thrown. Students compare their findings...
National Security Agency
Are You Ready to Call the Guinness Book of Records?
Learners design questions that can be answered by collecting data. In this line-plot activity, pupils collect data and graph on a line plot on world records. An abundant supply of teacher support is provided in this resource.
Curated OER
The Solar Cycle
Learners research the solar cycle. In this Science lesson plan, students use the internet to investigate the solar cycle. Learners produce a spreadsheet and graph from the information collected.
Curated OER
Creating Graphs
This graphing PowerPoint demonstrates how to use graphs to gather information. The slides contain examples of graphs and display the data clearly. This presentation also gives clear directions on how to construct various graphs by using...
Curated OER
Animal Science Research Report
Students research an animal. In this research instructional activity, students utilize various types of technology to gather information about an animal. Students create a class blog and use digital photography for their research.
Curated OER
Hover Above the Earth
Fourth graders build a balloon hovercraft, take direct measurements, answer critical questions, and make calculations using the data gathered in order to see the concept of acceleration as a change in velocity. They use a worksheet...
Pennsylvania Department of Education
Adding and Subtracting Three-Digit Numbers by Jumping
Second graders use data to graph information and draw conclusions. In this instructional activity on data analysis, 2nd graders practice gathering, sorting, comparing, and graphing data. Students differentiate data that can and cannot...
Curated OER
Activity Plan 5-6: What's In a Name?
Students use family names to gather and analyze data. In this counting lesson, students use graph paper to help organize their data and then, in a staircase fashion, organize the names from longest to shortest so they can answer...
Curated OER
This is the Way We Go To School
Second graders create and utilize a graph using the Excel computer program. They gather data regarding how the students get to school, tally the numbers for the class, and create a bar graph on paper and using Excel.
Curated OER
Graphing with the Five Senses
Students collect data and record it on a bar graph. In this data graphing lesson, each small group of students is assigned to collect data on one of the five senses. They then practice a song that helps them remember the purpose of each...
Curated OER
What's The Teacher's Choice?
Fifth graders explore how to use data and display it using a chart or graph. They use food choices for categories and then gather the data and use the provided chart for display. In small groups students discuss the data and the results.
Curated OER
Pen Pals
Learners collect bird count data at their sites, and share and compare the data collected from two different schoolyards using computer technology.
Curated OER
Nutrition and Food Security
Examine the three basic nutrients and their effects on the body. Fifth graders will research data to construct a bar graph and then demonstrate the relationship between malnutrition and food security. This is a very comprehensive...
Curated OER
Bird airport control
Students identify the various species of birds found in the wetlands. Students observe and record the key skills involved in scientific inquiry. Students handle and interpret data gathered on a field trip which reveals patterns and...
Curated OER
Favorite Season
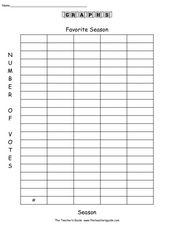
In this graphing worksheet, learners conduct a survey of people's favorite survey. They then complete 8 questions about the data gathered before creating a bar graph and pictograph on templates.
Curated OER
Range, Mean, Median and Mode Through the Internet
Students compute measures of central tendency. In this range, mean, median and mode instructional activity, students gather information on the internet, organize the data and then compute the measures of central tendency. ...
Curated OER
Range, Mean, Median, and Mode
Eighth graders find the range, median, mean, and mode of a data set. In this finding the range, median, mean, and mode of a data set lesson, 8th graders collect data about the high and low temperature for 10 different cities. ...
Curated OER
Temperature High and Lows
Young scholars gather high and low temperature readings through email. In this temperature graphing lesson, students use a spreadsheet to input data for a graph. young scholars interpret the graphs to compare and contrast the data from...
Curated OER
The Bigger they Are . . .
Pupils do a variety of data analyses of real-life basketball statistics from the NBA. They chart and graph rebounding, scoring, shot blocking and steals data which are gathered from the newspaper sports section.
Curated OER
Graphing Inertia: An Oxymoron?
Eighth graders investigate Newton's Law of Inertia in order to create a context for the review of the use of different types of graphs. They practice gathering the data from an experiment and put it into the correct corresponding graph.
Curated OER
Graphing Pockets
Second graders explore graphing. They count the number of pockets on their clothes and use Microsoft Excel to enter their data. Students create a class graph displaying their findings.
Curated OER
Galaxy Hunter - A Cosmic Photo Safari
Space science stars journey through our night sky and take virtual photos of galaxies to investigate simple random samples. Higher math is used to analyze the data collected. Copy the evaluation/assessment questions onto a handout...
Teach Engineering
Searching for Bigfoot and Others Like Him
Individuals create a GIS data layer in Google Earth that displays information about where one might find seven different cryptids. The class members research to find data on cryptid sightings they can include in their data...
Kenan Fellows
Using Water Chemistry as an Indicator of Stream Health
Will this water source support life? Small groups test the chemistry of the water drawn from two different sources. They then compare the collected data to acceptable levels to draw conclusions about the health of the source. The...


