Curated OER
Geometry, Measurement & Reasoning
Students construct two-column proofs. In this geometry lesson, students use deductive reasoning and geometric properties to justify given geometric statements. Students compare and contrast proofs.
Curated OER
High School Mathematics Problems from Alaska: Stanley Jonas Travel Problem
Students convert from one system of linear measure to another, graphing data from a table to a coordinate graph, using a graph to make predictions.
Virginia Department of Education
Exponential Modeling
Investigate exponential growth and decay. A set of six activities has pupils collecting and researching data in a variety of situations involving exponential relationships. They model these situations with exponential functions and solve...
Curated OER
Oranges and Stopwatches
Students measure various attributes of an orange. They discuss the attributes of an orange that can be measured, develop a list of attributes and describe how they can measure it, and rotate through four stations measuring the volume,...
Curated OER
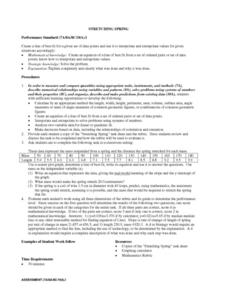
STRETCHING SPRING
Learners calculate the length, width, height, perimeter, area, volume, surface area, angle measures or sums of angle measures of common geometric figures. They create an equation of a line of best fit from a set of ordered pairs or...
Curated OER
Robo-Pull
Students solve linear equations using two steps. In this algebra lesson, students add, subtract, multiply and divide to solve linear equations. They apply concepts of equations to a robot pulling cargo.
EngageNY
Determining the Equation of a Line Fit to Data
What makes a good best-fit line? In the 10th part of a 16-part module, scholars learn how to analyze trend lines to choose the best fit, and to write equations for best-fit lines to make predictions.
Curated OER
Black Out
Students collect and analyze data. In this statistics lesson, students plot their data on a coordinate plane and find the line of best fit. They calculate the linear regression using the data.
Curated OER
What's Its Slope
Students identify the slope of a lines.In this algebra lesson, students define the meaning of slope and write an equation given the slope. They graph linear functions using the slope and y-intercept.
Curated OER
Length, Perimeter and Area
Learners analyze characteristics and properties of two- and three-dimensional geometric shapes and develop mathematical arguments about geometric relationship
Curated OER
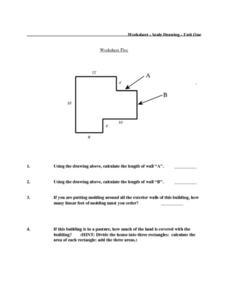
Worksheet Five
In this scale drawing worksheet, learners use the scale drawing of a building to calculate the length of two walls. They compute the amount of molding they must order (perimeter). Students calculate the area of the house to determine how...
Curated OER
Geometry of Exploration: Eyes Over Mars
Pupils research how engineers and scientists generate linear and angular measurements with geometry to survey the Earth and Mars. They assess how geometric shapes affect navigation. A surveyor comes to the classroom and explains how he...
Curated OER
French Fry Run
Student explore estimation and measurement. In this measurement lesson, 2nd graders measure french fries, graph their data, and determine the size of french fries that is the best value. Students practice how to add prices and calculate ...
Curated OER
Metric Rhyme
Learners identify various units of measurement. In this measurement activity, students learn several chants that combine metric vocabulary words and actions to reinforce the concepts learned.
Curated OER
Cold Hard Facts? What Inquiring Minds Will Know -- Inquiry-Based Ice Investigations
Students are introduced to the concepts of perimter, diameter, circumference and measurements. In groups, they complete two worksheets in which they determine if the ice dimensions make a difference in the way it floats. They discuss...
Curated OER
Discovering Pi
Students develop a formula that describes the functional relationship of the circumference of a circle to its diameter. Working with a partner, they measure the diameter and circumference of circular objects in order to discover the...
Curated OER
Hoping Backward to Solve Problems
Young scholars use number lines to compare differences. In this math lesson, students use a number line to solve problems. Young scholars predict differences and answer puzzles using subtraction.
Pennsylvania Department of Education
Using the Number Line to Compare
Students determine differences using a number line. In this math lesson, students use the number line to solve subtraction problems. Students solve puzzles using subtraction.
Curated OER
Tiling Tessellations
Learners explore tessellations. In this shapes and geometry lesson, students describe the attributes of many of the shapes displayed on an Elmo. Learners create examples of tessellations using pattern blocks.
Curated OER
Correlation of Variables by Graphing
Middle and high schoolers use a spreadsheet to graph data. In this graphing lesson, learners determine how two parameters are correlated. They create a scatter plot graph using a computer spreadsheet.
Curated OER
Functions Can Be Fun!
Eighth graders work together in groups to discover linear functions. They are giving a situation and they are to recreate it in their groups. They answer questions to complete the lesson.
Curated OER
Line of Best Fit
Students explore the concept of linear regression. For this linear regression lesson, students do a Barbie bungee activity where they collect linear data. Students plot their data using a scatter plot. Students determine a line of best...
Curated OER
Simple Angles
Third graders identify and construct right, acute and obtuse angles and begin to appreciate the degree and unit of measurement of angle. They know the degree value of angles that are simple fractions of a whole turn know that the angle...
Curated OER
Boxing On
Students participate in five center activities in which they construct three dimensional objects using cubic centimeter manipulatives such as sugar cubes and toothpaste boxes. They determine the volume of the objects. They build a model...

