Curated OER
Dental Detectives
First graders explore the theme of dental health and hygeine. They make tooth loss predictions, count lost teeth, and graph tooth loss. In addition, they listen to dental health stories, read online stories, create spreadsheets, and play...
Illustrative Mathematics
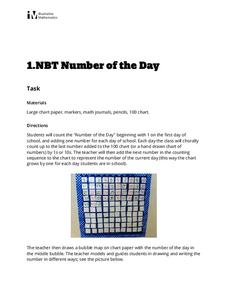
Number of the Day
Daily routines not only help to manage classrooms, they can also provide students with rich opportunities for learning. This activity supports young learners in developing their number sense by counting up the school days on a class...
Curated OER
Plastic Packaging
Students collect data. In this math instructional activity, students collect data about recyclable materials. Students develop a plan that will help the environment. Recycling plastic containers is discussed.
Curated OER
Handling Data: Collecting and Recording Data
Students collect and record data. In this collecting and recording data lesson, students collect data and record that data using frequency tables which include the x and y axis.
Curated OER
Olympic Medal Count
In this Olympic medals worksheet, students identify the country's flag and write the country name in the box next to it. Students add the country's abbreviation and watch the Olympic Games. Students put a mark in the appropriate box when...
Curated OER
Technology Literacy Challenge Grant Learning Unit
First graders explore counting and classification. They sort leaves, create graphs, write sentences for the data in the graphs, develop graphs for shapes, favorite animals, birthdays, and participate in a die prediction game.
Curated OER
All About Graphs
Students practice organizing data by creating graphs. In this statistics lesson, students survey the class about favorite colors and create a bar graph using the data. Students complete a test based on pet and animal statistics.
Curated OER
Clean up the Money!
In this money worksheet, students fill up a grid with coins and then roll dice to get ordered pairs and take the money of the ordered pair that they roll. Students then add up their money in the end and see who wins.
Curated OER
Measuring Volume/Capacity Using the Metric System
There is more than one way to measure an amount, as learners discover by applying multiple measurement tools in these activities. Centimeter cubes, cylinders, beakers, and measuring cups are used to find the volume of regular and...
Curated OER
First Grade Shoe Sizes
Third graders collect shoe size data from classmates in their room and another third grade. They predict what the most common shoe size will be. They place the data in an spreadsheet on the computer. They design a graph using the...
Curated OER
Excel Lesson Plan Coin Statistics
Second graders determine the difference between making a prediction and determining actual information. They design a spreadsheet for a coin flipping activity on which they include their predictions and what actual happens when they flip...
Curated OER
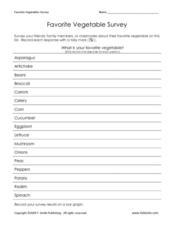
Favorite Vegetable Survey
What's your favorite? Use this chart template in your lesson on data collection and graphing. Learners record classmates' favorite vegetable in a survey, and then graph the results. A labelled graph is provided here- print both pages...
Curated OER
Our Favorite Pet
Students each have a turn, telling the class his or her favorite pet. The choices are cat, dog, fish or bird. Using the computer, the information from the tally be recorded on a spreadsheet and bar graph.
Curated OER
Virtual Field Trip
Are we there yet? Young trip planners learn about their state and plan a trip. They will select sites to see in three cities in their state, and record associated costs in a spreadsheet. While this was originally designed as a...
Curated OER
Coin Probability
Fourth graders, in pairs, receive three different types of coin bags. They pick coins out of the bag and tally what was picked fifteen times. They do it with all three bags for three separate tallies.
Curated OER
Organize Data
In this organizing data worksheet, students complete the tally chart for 'Votes for Team Mascot' and then use the chart to answer the six questions.
Curated OER
Rice (Gohan) Observations
Second graders investigate rice or gohan as it's called in Japan in a couple of experiments. They tally the results.
Curated OER
Recording Frequency
First graders analyze nursery rhymes and gather data about word frequency. In this frequency lesson plan, 1st graders create graphs and tables. Students interpret the data.
Curated OER
Pancakes, Anyone?
First graders explore data collecting and graphing. In this data collecting and graping lesson, 1st graders watch a video about monster who sells pancakes. Students make a graph to record the most popular pancake. Students also play...
Curated OER
Bird Probability
In this bird probability worksheet, students complete 12 different problems and short answer questions related to various types of birds. First, they determine what types of birds live in their forest by using the given table to record...
Curated OER
Heads or Tails?
In this probability worksheet, 1st graders toss a penny in the air 5 times and fill in a chart on how many times it landed heads up and/or tails up. Students complete this activity three times.
Curated OER
Range and Mode
Young scholars interpret data from graphs. In this range and mode lesson, students review a tally chart, pictograph and bar graph. Young scholars use these graphs to calculate the range and mode of each set of data.
Curated OER
Organising Data
Students complete data organization activities. In this data organization instructional activity, students watch online clips about organizing data. Students complete an eye color frequency table for their class. Students...
Curated OER
Circle Graphs
Sixth graders participate in a instructional activity that covers the reading and interpretation of a circle graph. They review the part of a whole concept for percents and student observe and practice using the circle graph.

