Curated OER
Water Down the Drain
Did you know that leaky faucets waste $10 million worth of water? Conservationists perform an experiment and draw best-fit lines to explore how the US Geological Society determined this value.
Mathematics Assessment Project
Temperatures
As a middle school assessment task, learners first examine line graphs of monthly temperatures for two locations, and then match box plots to each line plot.
Concord Consortium
Acid Test
This isn't your typical basic lesson—it's more acidic! Learners use pH information to determine the hydroxide ion concentration of different substances and then use these values to analyze information. The calculations require...
Concord Consortium
The Six Faces of Amzora
Here's a task that is out of this world! Given a description of a fictional cube-shaped planet, scholars answer a set of questions about the planet. They create a two-dimensional map and consider the distances between locations on the map.
Concord Consortium
Gestation and Longevity
Is the gestation length of an animal a predictor of the average life expectancy of that animal? Learners analyze similar data for more than 50 different animals. They choose a data display and draw conclusions from their graphs.
Concord Consortium
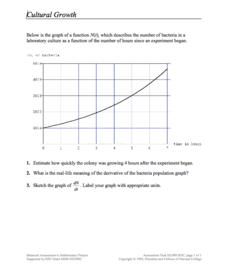
Cultural Growth
Scholars read and interpret a graph relating bacterial growth in a culture over time. They apply knowledge of derivatives, estimation, and graphing to the skill practice questions.
Concord Consortium
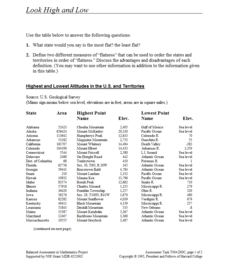
Look High and Low
From the highest high to the lowest low here's a resource that won't fall flat. Given data on the area and the highest and lowest elevations of each of the 50 states, learners decide which states are the least flat and the most flat. Of...
California Education Partners
Lashelles Garden
Let knowledge grow bountifully like plants in a garden. Given a diagram of a rectangular garden split into plots, scholars determine the area of the entire garden and the areas of the individual plots. As a culminating activity, they...
World Wildlife Fund
Graphs and Charts
A two-part worksheet incorporating bar graphs and pie charts, young mathematicians can practice their graphing skills. Pupils answer questions using graphs and charts but are also challenged to create their own using a given set of data.
Southwestern Medical Center
Field Epidemiology: Investigation of an Unknown Disease
More than 90 percent of the people in a building have come down with an illness, and it is your job to investigate. Teachers give scientists the data needed to decide what is important and how they can solve the mystery....
Chymist
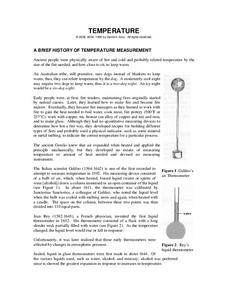
Temperature
Three Dog Night isn't just the name of a band; it is also the way an Australian tribe, who used dogs to stay warm, would describe the temperature on a cool evening. After reading about many different ways of measuring temperature, the...
Balanced Assessment
Solar Elements
Let your brilliance shine like the sun. Future mathematicians and scientists consider given data on the abundance of different elements in the sun. The assessment task requires consideration of how these different abundances relate to...
California Mathematics Project
Model Solar System
The sun's diameter is 864,337 miles—challenge learners to create a scale model of the solar system that fits in your classroom. Scholars make conversions and work with scientific notation as they create the scale model.
Statistics Education Web
Double Stuffed?
True or false — Double Stuf Oreos always contain twice as much cream as regular Oreos. Scholars first measure the masses of the filling in regular Oreos and Double Stuf Oreos to generate a class set of data. They use hypothesis testing...
Statistics Education Web
Are Female Hurricanes Deadlier than Male Hurricanes?
The battle of the sexes? Scholars first examine data on hurricane-related deaths and create graphical displays. They then use the data and displays to consider whether hurricanes with female names result in more deaths than hurricanes...
Statistics Education Web
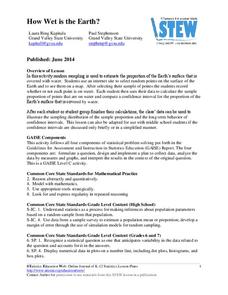
How Wet is the Earth?
Water, water, everywhere? Each pupil first uses an Internet program to select 50 random points on Earth to determine the proportion of its surface covered with water. The class then combines data to determine a more accurate estimate.
California Mathematics Project
Meteorology
See how estimation is essential to making temperature weather maps. Scholars use ratios and rates of change to estimate temperatures at locations where temperature readings have not been made. They connect this idea to linear functions.
Curated OER
Which Muscles?- Olympic Learn and Play Sports
In this math, science, and physical education worksheet, students brainstorm and study about the muscles that are used while participating in different Olympic sports. They color the muscle groups of the body by follow the directions...
T. Smith Publishing
Finding Percentages 6A
A list of 20 two to three-digit numbers asks math whizzes to determine specified percentages for each. The publisher has linked the assignment to CCSS.Math.Content.6RP.3, and it is targeted at the discreet skill of finding a percent of a...
Center of Excellence for Science and Mathematics Education
A Sick Astronaut
Aspiring astronauts graph, interpret, and analyze data. They investigate the relationship between two variables in a problem situation. Using both graphic and symbolic representations they will grasp the concept of line of best fit to...
Curated OER
Light and Our World
In this science worksheet, students solve a variety of curriculum related puzzles. They also practice basic mental math skills using four operations. The concept of light and color are explored and how it interacts with different objects.
Curated OER
Fish Count
In this science worksheet, students read about how scientists determine the total number of fish in a population. Students also participate in a related math activity.
Curated OER
Word Problem Primer
For this word problem worksheet, students are given directions and guidance as to how to solve word problems. They are given the variables used in word problems, the math codes, how to change letters into formulas and 5 steps to solving...
Curated OER
Pond Theme Unit
In this pond theme instructional activity students research facts on pond life. Students complete comprehension questions, crosswords, word search, and math puzzles. Students write a short report.
Other popular searches
- Math and Science Careers
- Integrated Math and Science
- Science and Math
- Science/ Math Games
- Math and Science Activities
- Integrating Math and Science
- +Math and Science Careers
- Math and Science Plan
- Math and Science Lessons
- Word Origins Science Math
- Math in Science Experiments
- Science Math


