Curated OER
Introduction to Measuring the Forest
Students investigate how much wood is in a forest. For this forestry lesson, students calculate how much usable wood comes from the forest. They will read, Sizing Things Up from Trees + Me = Forestry, measure firewood piles, and create a...
Curated OER
What's a Tree Worth?
Students calculate the board footage of a tree. In this forestry lesson, students use a Biltmore tree scale stick to calculate the number of board feet that would be produced. They quantify the economic value of a tree from this...
Curated OER
The Great Race
Students identify the mean, median and mode of collected data. For this statistics lesson, students collect, graph and analyze data using central tendencies. They work in groups to collect data on a robot through an obstacle course.
Curated OER
Organisms and Their Environment
Students explore Earth's biosphere. In this biosphere lesson, students participate in group activities regarding biotic and abiotic factors, population density, and species' habitats.
Curated OER
Fantastic Journeys
Students design a theme park attraction based on a fantastic journey from literature, film, or their own imaginations. They plan a multi-million dollar attraction based on a fantastic voyage from popular culture entertainment.
Curated OER
To Infinity and Beyond...Magazine of Planetary Studies
Students demonstrate their creativity by creating a magazine to express expository text. In this expository text lesson plan, students create a magazine in groups to creatively make text interesting.
Curated OER
A CEENic Galaxy Quest!
Young scholars research the distances between objects in the Milky Way. In this astronomy lesson, students calculate the time it would take for a robot to travel from Milky Way object to another. They create a travel package for...
Curated OER
Food Chains And Webs
Students investigate the concept of soil and all its components. They collect samples from a local site and transplant it into a terrarium. Students identify the organic elements, clay ,silt, and other forms of debris. They also identify...
Curated OER
CEENBoT Takes a Dive
Learners create a map to scale using technology. In this algebra activity, students navigate through a shipwreck to perform rescues. They use he CEENBoT program to perform the different tasks.
Curated OER
Inequalities
Sixth graders explore the concept of inequalities and how to solve them in the realm of integers. The instructor would benefit from using a number line and reviewing integers before using this lesson.
Curated OER
Metric Measurements
Sixth graders convert metric units of measurement. Classmates observe the use of a mnemonic for conversions. In groups, 6th graders practice converting metric units. They use a chart to describe how to convert between metric units of...
Curated OER
Ratios
Sixth graders investigate the concept of ratios and how they can be used to represent the comparison of quantities. The lesson is taught using a table or graph to compare two categories of data.
Curated OER
Geometric & Arithmetic Patterns
Eighth graders explore sequences. They discuss the difference between an arithmetic sequence and a geometric pattern. Students participate in workstation activities where they determine arithmetic or geometric patterns and predict the...
Curated OER
On Jupiter
Middle schoolers tour Jupiter. In this scenario based lesson, students examine the size of Jupiter and make models of the other planets in the solar system to show how large Jupiter is compared to the other planets.
Curated OER
Gathering, Recording, and Presenting Data
Sixth graders use the local newspaper to find and discuss examples of uses of statistics and the ways in which the information is presented. They create and represent their own set of data showing how students get to school each day.
Curated OER
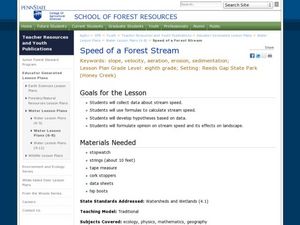
Speed of a Forest Stream
Students study stream speed. In this stream speed lesson students complete an activity and formulate an opinion and study its effects.
Curated OER
The Lake Effect
Fourth graders conduct an experiment demonstrating the effects of water and air temperature on precipitation. They create graphs demonstrating their findings using Claris Works for Kids.
Curated OER
Equivalent Fraction Munch with Pizza Pie
Learners demonstrate fractions and mixed numbers using concrete pictorial models of pizza. They relate symbols to the models.
Curated OER
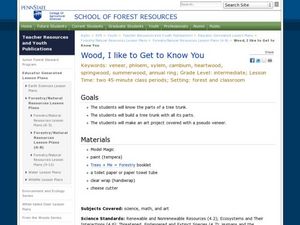
Wood, I Like to Get to Know You
Students examine trees. In this tree lesson, students create a model of a tree and its parts.
Curated OER
Heat Loss
Young scholars comprehend how heat loss is affected by exposed surface area. They decide what type of and how many data to
collect. Students decide how the results should be presented. They make a series of accurate observations
Curated OER
It's All in the Rings
Students examine how the environment influences tree growth. In this tree lesson, students analyze the growth of rings to see how plants adjust to adverse conditions in order to survive.
Curated OER
Download and Analyze
Students download information from a NASA website into a database. They transfer it to a spreadsheet by completing the information and analyze the information. They determine temperature averages, mode, and graph the results. They write...
Curated OER
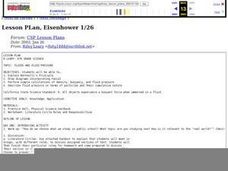
Eisenhower 1/26
Eighth graders identify and explain what Bernoulli's Principle is and draw diagrams to incorporate Pascal. They also perform simple calculations of density, buoyancy, and fluid pressure. Finally, 8th graders describe fluid pressure in...
Curated OER
Pump Up the Curriculum With Pumpkins!
Students complete a variety of activities as they examine "pumpkins."


