Curated OER
Accurately Weighing Pennies I
Drawing from a scenario of the history of the penny, learners write and solve a system of linear equations from a context.
Curated OER
Reflected Triangles
Your learners find and construct the line of reflection between a triangle's pre-image and its reflection image in this short activity.
West Contra Costa Unified School District
Matching Quadratic Functions
Ever sigh when learners ask why they have to know so many different forms of the quadratic equation? Here is a lesson that comes in handy! Using hands-on matching activities, quadratic equations are explored through...
American Statistical Association
How Random Is the iPod’s Shuffle?
Shuffle the resource into your lesson repertoire. Scholars use randomly-generated iPod Shuffle playlists to develop ideas about randomness. They use a new set of playlists to confirm their ideas, and then decide whether the iPod randomly...
Curated OER
How Many Pieces of Mail?
Fourth graders explore their multiplication skills. In this number sense lesson plan, students use their problem solving skills to solve a word problem that requires them to multiply 2 or 3-digit numbers by 1 or 2-digit...
Curated OER
Addition and Subtraction using Manipulatives
Sixth graders participate in a question and answer session to begin their understanding. Students complete a practice assignment using color counters. Students' assessment is composed of using color counters to complete an independent...
Curated OER
Selling Price
Students work independently to complete a problem solving activity that involves percent. This lesson is designed to be used as an assessment following a unit on percents. Students are presented with a problem involving a store that is...
Curated OER
Dating Practices
Students interpolate, extrapolate, and make predictions from given information. They present results and conclusions from given data using basic statistics. Pupils create a survey from a critical question and decide which sampling...
Curated OER
High Exposure
Young scholars interpret data they receive from the media, discuss possible misinterpretation of data from the media and correctly respond to the misconception quiz question.
Curated OER
Rational Function Graphs
Pupils use algebraic methods to represent and solve problems. Using a graphing calculator, students solve rational and inequality problems. They visually demonstrate solutions of functions through graphing. Pupils answer questions...
Curated OER
BASEBALL HOME RUN
Learners determine whether a hit baseball is a home run or not by utilizing parametric equations to describe the path of the ball. They assess the importance of angles and velocity needed to hit a home run. In addition, in their own...
Curated OER
River Optimization Problem
Students define the different methods used for optimizing a particular element of a problem. In this optimization problem lesson, students optimize appropriate details of a problem using data collection, algebra, technology, and/or...
Curated OER
Word Problems of Equal Share and Equal Groups
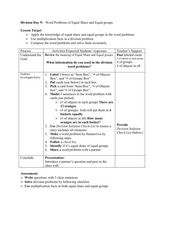
Fourth graders solve multiplication word problems. In this multiplication problem solving lesson plan, 4th graders view an example of how to group objects in a word problem. Students practice solving these word problems with partners and...
Curated OER
The Stained Glass Window
Middle schoolers use centimeter rulers and the attached worksheet containing a scale drawing of a stained glass window. The actual measurements of the stained glass window are given, and students are asked to find the actual measurement...
Curated OER
Why Isn't It 50-50
Students comprehend the difference between the outcome of the experiment and the outcome that they expected. They analyze outcome of probability experiment and compare theoretic and empirical results. Pupils discuss the difference in...
Curated OER
Studying for a Test
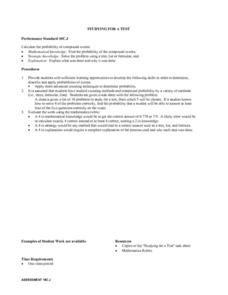
Students calculate the probability of compound events. They solve the problem using a tree, list of formulas and explain what was done and why it was done. Students develop the following skills in order to determine, describe and apply...
Curated OER
Excel Lesson
Students investigate Microsoft excel. In this technology lesson, students create formulas using excel and apply these formulas to solve relative, absolute and mixed reference cells. They perform immediate and delayed calculations.
Curated OER
Shapely Figures
Students are given magazines, scissors, glue, and one sheet of construction paper. They look for pictures showing real life representations of rectangular prisms, spheres, cones, and pyramids. Pupils cut out pictures showing each of...
Curated OER
Exploring Linear Equations And Scatter Plots - Chapter 5 Review
Students complete rolling stocks experiment, and collect and enter data on the computer. They enter data on graphing calculators, complete scatter plot by hand with line of best fit, and discuss different graphing methods.
Curated OER
The Apple Orchard Problem
Students explore various approaches to solving a problem of maximizing the total production of apples in an orchard. In this apple orchard instructional activity, students collect data in order to solve the apple orchard problem...
Curated OER
Fractions in Everyday Life
Students apply understanding of fractions by converting a recipe to feed the class and the whole grade level. They calculate how many cookies the class would eat and multiply each fraction in the recipe accordingly.
Cornell University
Mechanical Properties of Gummy Worms
Learners won't have to squirm when asked the facts after completing an intriguing lab investigation! Hook young scholars on science by challenging them to verify Hooke's Law using a gummy worm. Measuring the length of the worm as they...
Curated OER
Body Balance
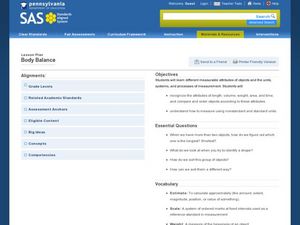
Examine measurable characteristics of objects to build an understanding of the different ways you can discuss an object's size when comparing it to other objects. After whole group instruction, the class compares and organizes several...
Curated OER
Mean Absolute Deviation in Dot Plots
The lesson focuses on the ideas of dot plot representations and the mean absolute deviation of data sets.


