Curated OER
Dance, Dance, Dance
Use dance and song to help your charges in adding whole numbers to 10. In this adding to 10 lesson, learners become the manipulatives as you add them.
Curated OER
Parallel Lines and Properties of Slope
Young scholars define functions to be graphed using the Y=key. They demonstrate how to set up a standard viewing screen using Zoom 6. They discuss and explore mathematical questions on a worksheet.
Curated OER
Cap-It to the Max
Eighth graders compare the volume of three cylinders constructed from the same size sheet of paper. They use concrete and graphical models to derive formulas for finding perimeter, circumference, area, and volume of two and three...
Curated OER
Maximize It!
Students design a rectangular box without a lid that has the largest possible volume using the supplied sheet of centimeter graph paper. They work in groups to construct different size boxes to determine the largest possible volume and...
Utah Education Network (UEN)
It's All Just Similar to Me
Middle schoolers explore the concept of similar figures. In this similar figures instructional activity, pupils calculate scale factors of similar triangles. They find missing sides of triangles, and measure angles using protractors and...
Curated OER
Estimating Solutions to Word Problems
Learners use estimation to determine the answers to word problems by rounding whole numbers. In this estimation lesson plan, pupils compare and contrast solutions using the best answer.
Curated OER
Sequencing From Close To Far
Students explore how objects stay the same size and only "look" like they change when closer are farther from the object. They sequence aerial photos and satellite images from closest to farthest.
Curated OER
Shadow Casting
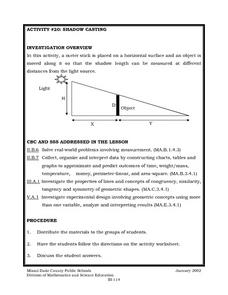
Eighth graders use a meter stick that is placed on a horizontal surface and an object is moved along it so that the shadow length can be measured at different distances from the light source. They solve real-world problems involving...
Curated OER
Trigonometric Form of Complex Numbers
This lesson is written from the perspective of a student teacher. A step by step lesson in which the class works on the trigonometric form of complex numbers. They convert between trigonometric and complex forms. They will also practice...
Curated OER
THE TRIANGLE INEQUALITY IN ANIMATION
Pupils open up the script to generate the sketch. They examine the viewing of the animation of a triangle. Students incorporate writing skills across the curriculum within this lesson.
Curated OER
Punch Patterns
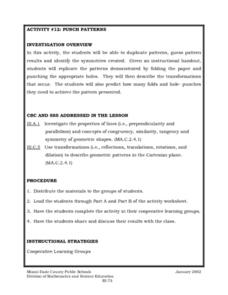
Fifth graders duplicate patterns, guess pattern results and identify the symmetries created. They are given an instructional handout, 5th graders replicate the patterns demonstrated by folding the paper and punching the appropriate...
Curated OER
Triangle Inequality
Students discover that the sum of the lengths of any two sides of a triangle must be greater than the third side. They are shown how a triangle is formed using three strips such as that the triangle is seen inside the strips.
Curated OER
A Picture is Worth a Thousand Words: Introduction to Graphing
Students practice graphing activities. In this graphing lesson, students discuss ways to collect data and complete survey activities. Students visit a table and graphs website and then a create a graph website to practice graphing.
Alabama Learning Exchange
Are You a Square or a Rectangle?
Discover the difference between standard and non-standard units of measure with your class. They differentiate between rectangles and squares, read a book, measure a peer's height. They then discuss measurement methods, make...
Curated OER
Data
Students collect data from an experiment they perform. For this data lesson, students use multiple representations to solve practical problems; describe advantages and disadvantages of the use of each representation. Then, they evaluate...
Curated OER
Paper Folding to Make Cubes
Examine patterns of figures composed of six-squares and predict which of the twenty presented could be folded to make a cube. They then fold large-scale patterns of these figures to confirm their hunches.
Curated OER
Puzzling Clue Vocabulary
Students play a matching, puzzle-like game designed to help them review and practice a given subject matter.
Curated OER
Greenhouse Effect ...Building Our Own
Young scholars explore the greenhouse effect. They set up a simplified model of the earth and the greenhouse effect. Students compare temperatures inside a jar to temperatures outside the jar. Pupils collect information and create a line...
Curated OER
Time Management
Students record their daily activities and graph the results using the educational software program called Inspiration. This lesson is intended for the upper-elementary classroom and includes resource links and activity extensions.
Curated OER
Property Lists for Quadrilaterals
Students establish classifications of shapes by various properties (angles, sides, etc.). They introduce the important properties of common shapes. Students develop an awareness of the wide variety of ways the 2-D shapes can be alike.
Curated OER
Fill and Wrap It Up
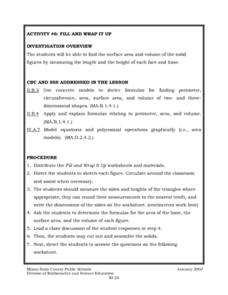
Students find the surface area and volume of the solid figures by measuring the length and the height of each face and base. They use concrete models to derive formulas for finding perimeter, circumference, area, surface area, and volume...
Curated OER
Interpreting Data from Birdfeeders
What kinds of birds live in your area? Read a book about birds to your learners and explore their feeding patterns. Charts and graphs are provided in this three page packet, but consider assigning the basic questions if using with young...
Curated OER
Making Logic Out of Madness
Tenth graders organize and interpret data from a student health program. In this physical education lesson, 10th graders use a body composition analyzer over 8 weeks to determine the validity of a student health program. ...
Curated OER
Students Favorites
Students complete activities using a frequency table and construct a pie graph for the data. In this frequency table lesson, students complete a survey to find data for a frequency table. Students use the given link to make a pie graph...


