Curated OER
Data Analysis: For Little Learners
Using pictographs, tally charts, and surveys, kids learn all about data analysis and collection. They make surveys, collect data, then construct pictographs and tally charts to organize their information.
CCSS Math Activities
Smarter Balanced Sample Items: High School Math – Claim 4
What is the appropriate model? Sample problems show the extent of the Smarter Balanced assessments Claim 4, Modeling and Data Analysis. Items provide pupils the opportunity to use mathematical modeling to arrive at a reasonable answer....
Curated OER
Reading Bar Charts
Help kids understand how to collect data through surveys, organize data in a bar chart, then analyze their findings. There are three different surveys for learners to conduct, a full description of all the parts of a bar chart, and three...
Curated OER
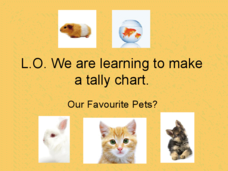
Pet Tally
Give the class an opportunity to practice using tally marks as a way to collect data. As you progress through the slide show, learners tally up the number and types of pets they see, they then use their data to create a tally chart....
Curated OER
Creating Tables and Bar Charts
A great way to introduce the concepts of data collection, bar charts, and data analysis. Learners see how their teacher used the data from fifty of her friends to construct a bar chart showing their favorite toys.
Curated OER
Probability Lesson 3
Here are a few well-thought-out discussion questions intended to accompany a probability activity. Learners consider equal chance outcomes under given situations, they investigate those outcomes by tossing a coin 30 times. They analyze...
Curated OER
Mrs. Lewis's Pets: Tally Mark Activity
To cute to pass up! This slide show activity has learners count the number of pets Mrs. Lewis has using tally marks. As the show progresses, kids pay attention and make a tally for each type of pet they see. Suggested uses and audio are...
DataWorks
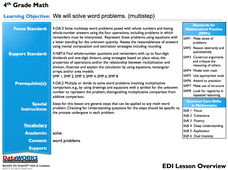
4th Grade Math: Multi-Step Word Problems
Solving word problems requires reading comprehension and math computation. Through an interactive slideshow presentation, fourth graders observe and follow each step toward solve multiplication and division word problems.
Mabry MS Blog
Scatter Plots
Scatter plots are a fun way to gather and collect relevant data. The presentation goes through several examples and then describes the different types of correlation.
Mathematics Assessment Project
Modeling Motion: Rolling Cups
Connect the size of a rolling cup to the size of circle it makes. Pupils view videos of cups of different sizes rolling in a circle. Using the videos and additional data, they attempt to determine a relationship between cup...
Curated OER
Chalkboard Challenge: 5th Grade Math Review
This math review PowerPoint engages fifth grade students in an interactive review of math concepts. This review game includes questions on numeration, data interpretation and number theory. This is in a "Jeopardy" style format.
Kenan Fellows
Using Water Chemistry as an Indicator of Stream Health
Will this water source support life? Small groups test the chemistry of the water drawn from two different sources. They then compare the collected data to acceptable levels to draw conclusions about the health of the source. The...
Teach Engineering
Show Me the Money
Class members learn how to estimate the total costs involved to design and build a bridge by including design, material, equipment, and labor costs. The activity includes a discussion about the trade-off between cost and aesthetics.
Kenan Fellows
Determining Stream Health by the Diversity and Types of Benthic Organisms
How diverse are the benthic organisms found in local streams? Using the information learned in previous lessons on identification of macroinvertebrates and on calculating stream index values, groups determine the health of local...
Other
U. Of Wisconsin: Formulating Statistical Questions and Collecting Data
This slideshow gives a detailed explanation of the characteristics of statistical questions and how they differ from other types of questions, the types of studies, and the methods for collecting data. It describes the case of Clever...


