Hi, what do you want to do?
CK-12 Foundation
Two-Sided Stem-and-Lead Plots: Gamers
Which gender spends more time playing video games? Your classes use provided data to answer this question. They first build a two-sided stem-and-leaf plot and then use the display to look for patterns. Guiding questions help them...
CK-12 Foundation
Single Bar Graphs: Hockey Teams
Raise the bar for hockey fans. Using data about favorite hockey teams, pupils build a bar graph. They use the information from the graph to make comparisons and solve one- and two-step problems.
Shodor Education Foundation
Multiple Linear Regression
You'll have no regrets when you use the perfect lesson to teach regression! An interactive resource has individuals manipulate the slope and y-intercept of a line to match a set of data. Learners practice data sets with both positive and...
Shodor Education Foundation
Scatter Plot
What is the relationship between two variables? Groups work together to gather data on arm spans and height. Using the interactive, learners plot the bivariate data, labeling the axes and the graph. The resource allows scholars to create...
CK-12 Foundation
Understand and Create Histograms: Histograms
Determine the shape of weight. Using the interactive, class members build a histogram displaying weight ranges collected in a P.E. class. Scholars describe the shape of the histogram and determine which measure of central tendency to use...
Curated OER
Among the Hidden - Population Math Activity
In this population worksheet, students collect data on population by researching the Census Bureau and then make online graphs and answer short answer questions about the data. Students complete 5 problems total.
Curated OER
My Test Book: Tally Charts
In this online interactive math worksheet, students solve 10 problems that require them to read and interpret tally chart data. Students may submit their answers to be scored.
Curated OER
Milkweed and Monarch Butterfly Mania: Measuring
In this milkweed and monarch butterfly mania: measuring worksheet, learners use photos of milkweed plants and caterpillars next to a ruler to estimate the measurements of 10 leaves and 15 caterpillars, calculating and recording...
Curated OER
Pints and Quarts
In this measurement worksheet, students study the sets of pints or quarts for the 7 problems. Students circle the set of measurements that are less.
Concord Consortium
Concord Consortium: National Health and Nutrition Examination Survey Data Portal
Access and explore large datasets from the National Health and Nutrition Examination Survey (NHANES, 2003). Working with large datasets that emphasize exploration, finding patterns, and modeling is an essential first step in becoming...
Concord Consortium
Concord Consortium: California American Community Survey (Acs) Data Portal
Working with large datasets that support exploration of patterns is an essential first step in becoming fluent with data. In this dynamic data science activity, students can access part of the U.S. Census Bureau's American Community...
Annenberg Foundation
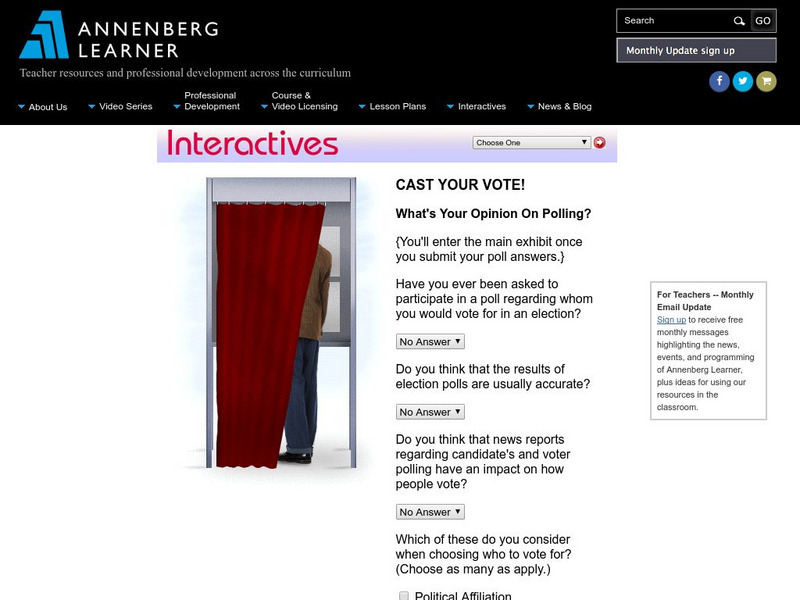
Annenberg Learner: Interactives: Cast Your Vote!
Upper elementary, middle, and high school students can use this exhibit to get an understanding of how polls and elections are conducted. The discussion includes random samples, margins of error, and other concepts related to statistics.
Khan Academy
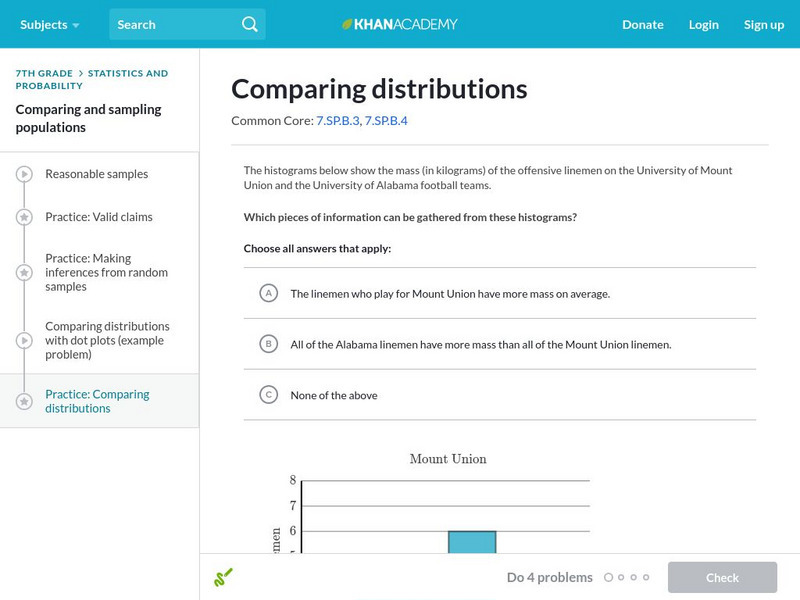
Khan Academy: Comparing Distributions
Practice comparing distributions of data in different forms of graphical representation.
TeacherLED
Teacher Led Interactive Whiteboard Resource Survey
Students can explore surveys, pie charts, and bar graphs with this interactive white board resource.


