Curated OER
Graphing Favorite Colors
Third graders collect data and insert it into ClarisWorks to create a spreadsheet/graph of their favorite color. They interpret the data together.
Curated OER
Finding PI
Students select and use appropriate operations, methods and tools to compute or estimate using whole numbers. They develop and use formulas for determining the circumference and area of circles. Students determine and describe the...
Curated OER
No Bias Allowed
Students differentiate graphical representations looking for the bias. They use a systematic process in order to solve problems. Students explain how a problem is solved and the steps involved. Even deeper than this is giving the...
Curated OER
M&M Exponential Activity
Young scholars create a scatter plot of their experimental data. In this algebra lesson, students use M&M's to determine an algebraic model. They discuss results in class.
Curated OER
Mathematical Models with Applications: What's Your Rate of Change?
Students use regression methods available through technology to select the most appropriate model to describe collected data and use the model to interpret information. They use numeric techniques to write the equation of a line that...
Curated OER
Statistical Accuracy and Reliability
Ninth graders assess the accuracy and reliability of current survey data and how it is represented. They design a survey, collect data, and use technology to analyze the data and present the results. Students examine scatter plots and...
Curated OER
Scatter-Brained
Seventh graders graph ordered pairs on a coordinate plane. They create a scatterplot. Additionally, they determine the line of best fit and investigate the slope of the line. Multiple resources are provided. An excellent resource!
Curated OER
Code Breakers
Students collect data and make a frequency table, change ratios into percents, and analyze data to make predictions.
Curated OER
Make Your Own "Weather" Map
Students create their own "weather" map using data from x-ray sources. They analyze and discuss why it is important to organize data in a fashion in which is easy to read. They compare and contrast different x-ray sources using a stellar...
Curated OER
Virtual Field Trip/ Gasoline Cost
Students complete a word problem to determine the cost of gasoline per mile of their virtual field trip. They determine the travel time and gasoline costs for two routes and record the information on a data sheet. They check their work...
Curated OER
Graphing
Seventh graders identify the different graphs used in science. In this graphing lesson, 7th graders analyze the three kinds of graphs. They construct a graph that best describes a given data.
Curated OER
Block & Tackle
Learners participate in a lab experiment in which they discover the need for so many blocks and tackles on sailing ships. In groups, they make and test their predictions and practice measuring objects in various units. They record and...
Curated OER
Do new kinds of insects appear after soil modification?
Students explore and experiment with the concept do new kinds of insects appear after soil modification. They assess and review scientific methods of observation, predicting, variables, math skills, ratio, proportions, graphs and the art...
Curated OER
Probability With a Random Drawing
Students define probability, and predict, record, and discuss outcomes from a random drawing, then identify most likely and least likely outcomes. They conduct a random drawing, record the data on a data chart, analyze the data, and...
Curated OER
Untitled Document Aerospace Team Online:
Students explain the historical significance of use of the scientific method in developing the first airplane and appreciate the process involved in developing a new technology.
Curated OER
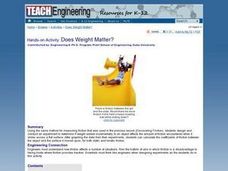
TE Activity: Does Weight Matter?
Young scholars design and conduct experiment to determine if weight added incrementally to an object affects amount of friction encountered when it slides across a flat surface. They graph data from their experiments, and calculate...
Curated OER
Collect Data Using a Transect Line
Learners learn about transect lines through a study of marine debris. In this marine debris instructional activity, students calculate the items on a transect line and graph them. Learners complete a category worksheet.
Curated OER
Slip Slide'n Away
Young scholars analyze the sliding of boxes along a warehouse floor. In this algebra lesson, students connect math and physics by calculating the friction created by the sliding of each box. They develop faster method to move the box,...
Curated OER
Mathematical Magazines
Students classify and tabulate the type of advertisements found in a collection of magazines. Determination is made on what percent of the total number of ads each type represents. They present their results orally and in a graph.
Curated OER
Putting Your Best Foot Forward
Third graders measure their feet and their parents' feet, record data on computer-generated graphs, and calculate and record mean, median, and mode.
Curated OER
Technology vs. Nontechnology
Fourth graders determine the range, mean, median and mode using a computer spreadsheet. An identical set of calculations is done without using a computer. The results of each method are compared. They calculate the mode, median and range...
Curated OER
Graphing Aquatic Insects
Students identify aquatic insects. For this organism lesson, students locate aquatic insects near a local waterway and collect them. Students graph the amount of insects that they collected.
Curated OER
Alternative Energy Part II - Lesson Eight of Eight - Energy Conversion and Propulsion
Students investigate the results of different propulsion methods. In this propulsion lesson, students measure the distance a test toy car goes using different types of propulsion. They record the distances in data tables before...
Curated OER
Cell Phone Plans
Students relate the use of a cell phone to math. In this algebra instructional activity, students collect data on the usage of their phones and plot it. They analyze the graph and make predictions based on the rate per minute.


