Curated OER
The Fuelish Fact Finding
Students define fluctuation and the price of food. In this algebra lesson, students create a budget to live on based on their living expenses. They create a chart and explore the cause and effect of real life scenarios.
Curated OER
Probability and Sports
Students research topics on the internet where probability is relevant. Students study statistics and probability concepts by looking at practical questions that arise in professional sports.
Curated OER
Paper Planes
In this unit, 3rd graders investigate one variable to see if they can make a paper plane fly farther. They use scatter plots to establish a possible relationship between variables then use what they have found to make a paper plane to...
Curated OER
Statistics: Misleading or Accurate?
Students explore the concept of misleading statistics. In this misleading statistics lesson plan, students play a game of tag and graph the number of times each student gets tagged. Students use the graph to determine the fastest...
Curated OER
Probability and Statistics
Young scholars reason mathematically as they solve problems dealing with probability of an even occurring. In this probability instructional activity, students differentiate between different rankings of candidates running for...
Curated OER
Graphing and the Coordinate Plane
Students gain practice reading coordinates and plotting points by participating in the Coordinates! Game. They demonstrate and test their skills with graph paper and the Maze Game.
Curated OER
C is for Cookie-A MEAN-ingful Graphing Activity
Third graders, in groups, dissect a variety of brands of chocolate chip cookies and calculate the mean for each brand. They create their own bar graphs, pictographs, and line graphs to represent information.
Curated OER
RISKY BUSINESS--OR NOT!
Students learn about the importance and risk that stocks carry within a business. For this financial management lesson, students use role play and case scenario situations to decide what stocks are best for given companies. Based on the...
Curated OER
Fire!, Probability, and Chaos
Students explore the concept of probability. In this probability lesson, students simulate a controlled forest burn using an applet. Students vary the probability of trees burning and predict what will happen.
Curated OER
Designing Samples/Simple Random Samples
High schoolers explore the concept of sampling techniques. For this sampling techniques lesson, students identify possible sources of bias in situations such as phone polls, supermarket surveys, and drawing names from a phone book. High...
Curated OER
The Quadratic Formula
Students solve quadratic function by completing the square. In this algebra lesson, students use the quadratic formula to factor quadratics and find the roots. They graph the parabola and identify its properties.
Curated OER
How Sharp Is Your Memory?
Students play a memory game as they explore reasoning. In this algebra lesson, students identify concepts using pictures and words. They model real life scenarios using hands on manipulatives.
Curated OER
Making Good Investments
Students compare different aspects of investing money from traditional savings accounts to money market accounts. They research investment accounts at local banks and compare them.
Curated OER
Selling Solutions
Young scholars identify, design and present specific information to sell their idea for reducing the impacts of climate change. Students create a television or print advertisement. Young scholars utilize technology to create a final...
Curated OER
Creating Circle Graphs with Microsoft Excel
Students create graphs of circles. In this geometry lesson, students use Microsoft Excel to create graphs. They construct the graphs using paper and pencil as well as the computer.
Curated OER
The Price Is Right
Students create a list of products with estimated prices. In this algebra instructional activity, students learn to write equations using variables. They match their created list with that of actual products and compare their...
Curated OER
Make Your Own "Weather" Map
Students develop and apply a variety of strategies to solve problems, with an emphasis on multi-step and non-routine problems. They acquire confidence in using mathematics meaningfully.
Curated OER
Mathematical Magazines
Students look through magazines and calculate the percentages of the types of ads in the magazines. In this percentages lesson plan, students create a graph to show their results.
Curated OER
An Introduction to Elementary Statistics
Students explain and appreciate the use of statistics in everyday life. They define basic terms used in statistics and compute simple measures of central tendency.
Curated OER
Under the Weather
Students review mean, median, mode, and range while using the newspaper to answer weather questions.
Shodor Education Foundation
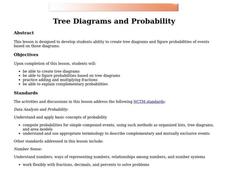
Tree Diagrams and Probability
Aspiring statisticians create tree diagrams and figure probabilities of events based on those diagrams. They practice adding and multiplying fractions and explain complementary probabilities. Students use computers activities to make...
Curated OER
Ants in Your Pants
First graders read "One Hundred Angry Ants" by Elinor Pinczes. They identify various sums that equal ten and display them on a chart.
Curated OER
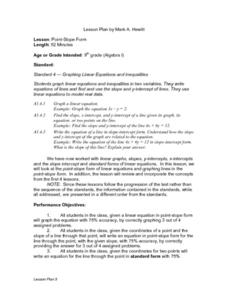
Point-Slope Form
Ninth graders explore the point-slope form of linear equations and graph lines in the point-slope form. After completing the point-slope equation, they identify the slope of a line through a particular point. Students explain the...

