Curated OER
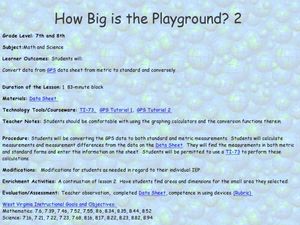
How Big Is The Playground?
Students calculate the standard and metric measurements of a playground. In this measurement instructional activity, students use GPS coordinates and graphing calculators to determine the dimensions of an area outside of the school in...
Radford University
Connecting Scatter Plots and Correlation Coefficients Activity
Collect a variety of bivariate data. Groups determine sets of data that would provide a positive, negative, and no correlation. Team members gather their data through out the week. Scholars plot the data and determine the relationship...
Curated OER
Shots, Standings, and Shopping
Rates and ratios can easily be applied to real-world situations. Learners explore a series of websites in order to procure comparable data. They define ratios and rates, view videos, and use the internet to explore how ratios and rates...
Curated OER
M & M Madness
Students work with the mathematics unit of collection, organization, and presentation of data. In this math and technology lesson plan, students use Valentine M & M’s and The Graph Club to sort and graph the various colored M & M’s.
Curated OER
Plastic Pollution
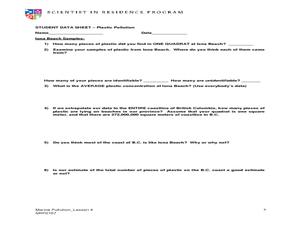
Young scholars determine with math concepts how much plastic pollution is affecting marine life. In this plastic pollution lesson plan, students collect scientific data from a field trip to a water treatment plant.
Curated OER
Pet Shop Decision
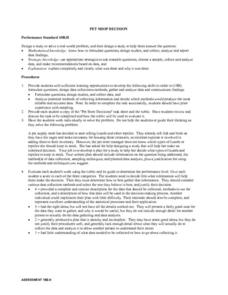
Students are given the "Pet Store Decisions" task sheet and a rubric that goes with it. Students discuss the task and make a plan for using the rubric sheet to complete the task. Students formulate questions, studies and data collection...
Curated OER
Counting
First graders explore collecting data. They collect data using a data collection sheet and enter the data into Excel. Students create graphs using Excel. They share their graphs with the class.
Curated OER
Favorite Food
Students are given three choices of food. They then decide on their favorite and predict what the class's favorite food will be. After the teacher enters the data into the computer, students gather around the computer to view the...
Curated OER
"who Lives in Your House?"
Fourth graders collect data about the people and animals living in their homes, and the students' shoe sizes. They work in groups to enter the information into a database from which they create graphs. They analyze the data to find the...
Curated OER
Survey Says...
Young learners create and implement a school-wide survey about student body favorites! Learners record and analyze the data on a bar graph, picture graph, and line graph, and then display the data. Then, wrap it all up with a celebration...
Curated OER
Making Sense of the Census
Students problem solve the mean and median of agricultural data by completing a worksheet. They discuss the results of the statistical data.
Curated OER
Explore the Arctic: Tracking the Dog Teams in the Ididarod Race
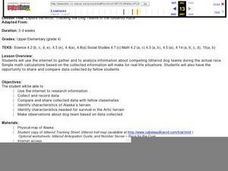
Fourth graders use the Internet to gather and analyze information about competing Iditarod teams during the actual race. They also have the opportunity to share and compare data collected by fellow students.
Curated OER
Graph Lesson
First graders collect data on different eye colors of each student in their classroom. They input the data that they gathered in an Excel spreadsheet and then create a graph in Excel.
Curated OER
Do You Measure Up?
Students measure their height and then they will input the information into a spreadsheet. After the data is entered, students will use the material gathered to create a bar graph showing the heights of people in their class.
Curated OER
Investigation 7 - Interpreting Weather Data
Fourth graders interpret the weather data they gathered in Investigation 6. They take an average of each component in each season. They compare the same components of each season and write the differences they see between the seasons.
Curated OER
Effects of Temperature, Deviation on Climate
Students collect and record data for a given city. They calculate standard deviation of temperature and analyze the impact of climate changes on a city's and culture.
Curated OER
Math and the NFL - Statistical Representations
Seventh graders use the Internet to get current sports information for data analysis. They use their data to find the mean, median, mode and range. Students then place their data on a spreadsheet.
Curated OER
Statistics Newscast in Math Class
Young scholars study sports teams, gather data about the teams, and create a newscast about their data. For this sports analysis lesson, students research two teams and define their statistical data. Young scholars compare the two teams,...
Curated OER
Making Math Meaningful in March Madness
Middle schoolers examine the statistics of March Madness, the college basketball tournament. They watch videotaped basketball games to collect data for further analysis using Word and Excel. They analyze the data in a variety of...
Curated OER
Chart This!
Students collect and analyze data. In this middle school mathematics lesson, students collect data on three to four traits or favorites. Students analyze their data and create a chart of graph for each trait or favorite they...
Illustrative Mathematics
Mr. Brigg's Class Likes Math
A quick discussion question that brings some collaboration into your classroom will allow your thinkers to make a decision about sampling. Mr. Briggs wants to know if the results from his class are a valuable comparison to the entire...
Curated OER
A Weigh we Go!
Here are some cross-curricular activities whil should help your kids understnad weight measurements and grammar. In this grammar and math lesson, students read the book Skittles Riddles and practice counting and balancing skittles. They...
Curated OER
Ketchup to Collecting Data
First graders collect data for a survey of 3 brands of ketchup and create class charts. They taste test three different brands of ketchup, and use the data to create a presentation. Tasty lesson!
Curated OER
Capture/Recapture
Students use proportions to estimate the size of populations. They describe the data with using a graph or table of the estimate. Students use descriptive statistics to calculate mean, median, and mode. They also compare and contrast an...
