Curated OER
Opinions, Please!
Young scholars discuss the meaning and purposes of polls and surveys. After reading an article, they analyze the results of a poll given to residents of New York City. They create a survey of their own and analyze the data to write a...
Curated OER
Classification of Cerealites
Middle schoolers create a dichotomous key. In this categorizing lesson, students create a dichotomous key for different types of cereal. Middle schoolers classify the cereal into groups such as flakes and cereal with holes. Students...
Curated OER
The Bio-fuel Project: Creating Bio-diesel
Students investigate bio-fuel. In this investigative lesson, students create bio-fuel from vegetable oil waste. Students will analyze, predict, collect and synthesize data from their experiments with bio-fuel.
Curated OER
Eratosthenes And Radius of the Earth
Students calculate the radius of the earth. They use the method and data suggested by Eratosthenes. They investigate the interrelationships among mass, distance, force, and time through experimental processes.
Curated OER
Circles Minilab
Students learn how to measure the diameter and circumference of a circle. In this circle activity, students organize their data to create a graph. Students utilize their graph to make an inference about the slope of pi.
Curated OER
Impact!!
Students perform a science experiment. In this algebra lesson plan, students collect data from their experiment and create a graph. They analyze the graph and draw conclusion.
Curated OER
Measuring to the Nearest Inch
Third graders use whole numbers and fractions to make connections between abstractions of the mathematical world and the real world. In this fractions and measurement lesson, 3rd graders identify, quantify groups , and measure distances....
Curated OER
Technology Literacy Challenge Grant Learning Unit
First graders explore counting and classification. They sort leaves, create graphs, write sentences for the data in the graphs, develop graphs for shapes, favorite animals, birthdays, and participate in a die prediction game.
Curated OER
Home Measurement
Students explore the differences between the heights of their family members as they measure, record, and compare the data gathered. Comparisons are made to discover who was the tallest and the shortest member.
Curated OER
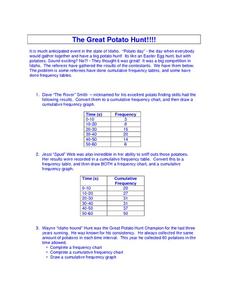
The Great Potato Hunt
In this science worksheet, students examine the data from the potato hunt where potatoes are found like Easter Eggs. The data of the number of potatoes found is recorded in the frequency tables.
Curated OER
Bird Probability
In this bird probability activity, learners complete 12 different problems and short answer questions related to various types of birds. First, they determine what types of birds live in their forest by using the given table to record...
Curated OER
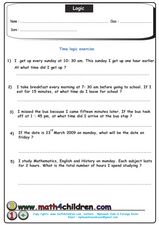
Logic
In this logic worksheet, learners read logic puzzles. They use tables and Venn diagrams to organize data and determine the answer to the question. This ten-page worksheet contains 16 problems. Answers are provided on the last half of the...
Curated OER
Math: Reaching New Heights
Students apply math skills to assess the range, mean, mode, and median of data sets. Using a "Reaching New Heights" worksheet, they review and discuss how to calculate the answers. Students write complete explanations of all their...
Curated OER
Plant Diversity and Distribution
Learners construct a defined plot on school grounds and observed patterns in plant life. They count trees, shrubs, cacti and record on a data sheet. They compare data and generate a plant diversity overlook for their school.
Curated OER
Jack and the Beanstalk Math
Students listen to Jack and the Beanstalk and determine what they think are the most common words. In this Jack and the Beanstalk lesson plan, students reread the story, count the words they chosen and graph those words. Students...
Curated OER
Fire Safety Survey
Learners collect data regarding fire safety and create a graph. Working in small groups, they administer a survey to family and friends regarding their attitudes toward fire safety. After data has been gathered, students graph their...
Curated OER
Drip, Drip, Drip or The Case of the Leaky Faucet
Students explore the cost of wasted water. In this math lesson plan, students conduct an experiment in which they collect data on how much water is lost when a faucet leaks. Students figure the cost of the water that was wasted.
Project SMART
Exploring the History of Mathematics
Learners research six different mathematicians using Internet resources. They examine the contributions of different cultures, women, and one that made a significant to geometry. They present their research to the class.
Curated OER
Using Diagrams in Problem Solutions
Students use tables, graphs and diagrams to collect data. In this problem solving with diagrams lesson plan, students construct their own tables and graphs containing information they gather from a drawing. They also make a Venn Diagram...
University of Colorado
The Moons of Jupiter
Can you name the three planets with rings in our solar system? Everyone knows Saturn, many know Uranus, but most people are surprised to learn that Jupiter also has a ring. The third in a series of six teaches pupils what is around...
Curated OER
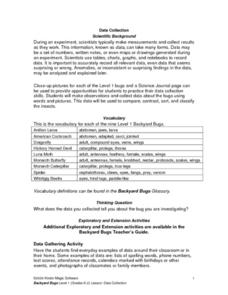
Science: Backyard Bugs Data Collection
Young scholars practice data collection skills by observing common bugs found in their local environment. Once the data is collected they complete data sheets to compare, contrast, sort, and classify the insects. The lesson includes...
Radford University
Staircases and Ramps
Ramp up the study of slope. The class participates in a discussion about the physical aspects of stairs and ramps they encounter. Small groups work together and measure a staircase and corresponding ramp to calculate the slope of each....
Curated OER
MAISA and the REMC Association of Michigan
Students complete online research to study geography's impact on weather. In this geography and weather lesson, students research weather in their city for ten days using an online website. Students bookmark the site, enter data into a...
Curated OER
Size It Up: Map Skills
Compare information from a US population cartogram and a standard US map. Learners draw conclusions about population density by analyzing census data a population distribution. They discover that census data is used to apportion seats in...

