Curated OER
Tallest Stack Wins
Students build a stack of pennies as tall as possible, recording the number of pennies they are able to stack before the tower falls. Then, sharing answers, they determine the average number of pennies that could be stacked.
Curated OER
Rent and owner's major payments
Students retrieve and map census data to determine the average rent and owners' payments made throughout Canada. They find out how many people are spending more than 30 percent of their income on housing.
Curated OER
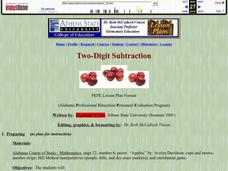
Two-Digit Subtraction
Second graders identify two-digit numbers, and solve two-digit subtraction problems.
Curated OER
Calculator Addition
First graders work with calculator to add, create an addition number sentence, and plug the number sentence into the calculator and get an answer.
Curated OER
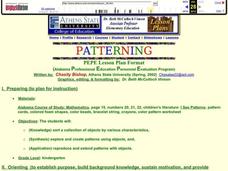
Patterning
Students sort collection of objects by various characteristics, explore and create patterns using objects, and reproduce and extend patterns with objects.
Curated OER
Fickled Fractions
Students explore which fractions are made real in our world. They also show the relationship of cross multiplication and equivalent fractions To reinforce fraction skills.
Curated OER
Mathematics and the Art of M.C. Escher
Students discover the connection between Escher's art and mathematics. They give various presentations based on their study.
Curated OER
Rectangular Prism Net
In this geometry worksheet, students cut out a rectangular prism net. They cut along the dotted lines as indicated the scissors icon, and fold the piece along the solid lines to form the three-dimensional shape. There are no directions...
Curated OER
Cube Net
In this geometry and art worksheet, 3rd graders trace and cut out a cubic net to fold and glue together to learn about the dynamics of three-dimensional figures and shapes.
Curated OER
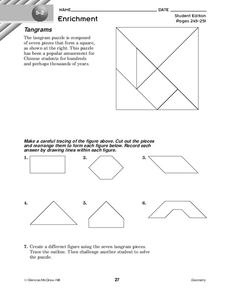
Tangrams
In this tangrams learning exercise, 10th graders solve 7 different problems related to designing tangrams. First, they trace each of the figures shown on the sheet. Then, students cut out the pieces and rearrange them to form each figure...
Curated OER
Canada's Climate: Temperature and Rainfall Variations
Students analyze data about various climates in Canada. In this data analysis and climate activity, students use Canada Year Book 1999 to complete a worksheet and make connections between precipitation and temperature in different climates.
Curated OER
IT IS ABOUT SUPPLY AND DEMAND.
Students learn that the price of an item is defined by its supply and demand. In this instructional activity students graph the relationship between demand and supply of various products, students also consider hidden costs.
Curated OER
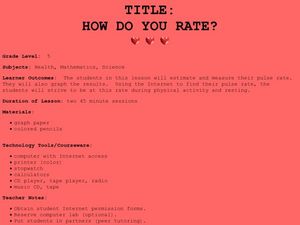
How Do You Rate?
Fifth graders make a graph. In this pulse rate lesson, 5th graders estimate their pulse and record it. Students measure their pulse while at rest and after physical activity and record it. Students use the internet to graph their results...
Curated OER
Literal Equations
Students explore Literal Equations. In this literal equations lesson plan, students use the Internet to connect to links and solve linear equations. Students investigate, analyze and record their findings on various activity worksheets.
Curated OER
Finding Primes-The Sieve of Eratosthenes
For this middle school/Algebra I worksheet, students use the sieve of Eratosthenes to determine the prime number less than two hundred. The one page worksheet contains one problem. Answer is not provided.
Curated OER
Lesson 2: Ultimate Classroom - Web Model
Students create a scale drawing. In this ultimate classroom lesson, groups of students create a scale drawing of the ultimate classroom. They explore the and explain the constructed design.
Curated OER
Statistical Analysis
For this statistics worksheet, students analyze the data provided in order to determine the null hypothesis, an alternate hypothesis, and the significant difference between the groups. The one page worksheet contains three...
Curated OER
Checking Test Comparability/Scattergrams
Students construct a scattergram graph. In this statistics lesson plan, students graph data by hand and using a spreadsheet program. They establish lines of best fit and draw conclusions using their graphs.
Curated OER
Catches and landed value of fish
Students analyze data. In this secondary mathematics lesson, students read and retrieve data from a statistical table on the Canadian fishing industry. Students interpret and describe data in mathematical terms and make...
Curated OER
Chart the Stars
Seventh graders find constellation distances and plot the stars. For this star lesson, 7th graders plot the star points for Canis Major. Students use graphing calculators to graph the constellation. Students choose another constellation...
Curated OER
Chinese Tangrams
Students research the history of Chinese tangrams and complete tangram activities. In this tangram lesson, students complete Internet research to learn the history of Chinese tangrams. Students construct a set of tangrams, compare the...
Curated OER
Designed to Scale
Seventh graders construct a three dimensional model of a constellation. For this constellation lesson, 7th graders make a blueprint for a scale model of the constellation and create their models. They present their models to the class.
Curated OER
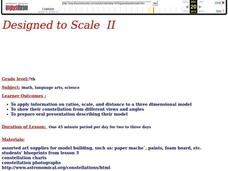
Designed to Scale
Seventh graders study ratios, scale and distances according to a three dimensional model. In this exploratory lesson students create their own constellation and prepare an oral presentation that describes their model.
Curated OER
Youth vs. Adult Employment
Learners investigate the unemployment rate in Canada. In this statistics lesson plan, students collect data on youth finding jobs, graph and analyze the data. This assignment raises awareness of the employment problems in Canada.
Other popular searches
- Math Enrichment Activities
- Math Enrichment Worksheets
- Free Math Enrichment
- Enrichment Math Centers
- Math Enrichment 3rd Grade
- Math Enrichment and Graphs
- Math Enrichment Lessons
- Elementary Math Enrichment
- Enrichment Math
- Math Enrichment Lesson Plan


