Curated OER
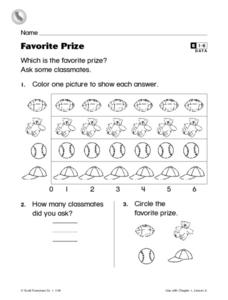
Favorite Prize
In this graphing worksheet, students focus on the usage of a pictograph. Students poll classmates and respond to 2 questions about the graph that they have created.
Curated OER
Graphosaurus
Students complete bar graphing activities with a dinosaur theme. Students discuss their favorite dinosaurs, collect data about the discussion, and make a floor graph of the information. Students complete a dinosaur graph worksheet.
Curated OER
Do You Like to Spend or Save?
Students, after briefly discussing spending and saving habits, take a poll to see how their peers like to manage money. Then students graph their findings and discuss the survey results.
Curated OER
Circle Art
Young scholars investigate two and three dimensional shapes. In this geometry lesson, students write equations of circles and graph them correctly. They create pictures using circles.
Curated OER
Macbeth Madness
Students research Macbeth online and complete computer and graphing activities for the play. In this Macbeth activities lesson, students research Macbeth and bookmark the URL's. Students complete activities for the topic on spreadsheets...
Curated OER
Functions Made Easy
Middle schoolers explore concept of functions as relationships, as machines, as equations, and as graphs.
Curated OER
Chart the Stars
Seventh graders find constellation distances and plot the stars. For this star lesson, 7th graders plot the star points for Canis Major. Students use graphing calculators to graph the constellation. Students choose another constellation...
Curated OER
Introducing Linear Terminology
Ninth graders graph linear equations and inequalities in two variables and then, they write equations of lines and find and use the slope and y-intercept
of lines. They use linear equations to model real data and define to define the...
Curated OER
Point-Slope Form
Ninth graders explore the point-slope form of linear equations and graph lines in the point-slope form. After completing the point-slope equation, they identify the slope of a line through a particular point. Students explain the...
Curated OER
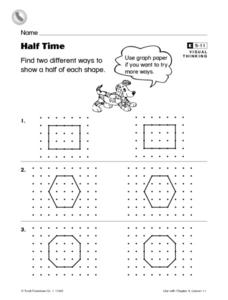
Half Time
In this shapes activity, 1st graders study and analyze how to cut three different shapes on dotted lines in half, two different ways on each line.
Curated OER
POWER OF VOTING
Fifth graders explain the process of a national presidential election by researching through the Internet and holding an election simulation. They collect, graph, and interpret election data. They enhance their computer skills by...
Curated OER
IT IS ABOUT SUPPLY AND DEMAND.
Students learn that the price of an item is defined by its supply and demand. In this instructional activity students graph the relationship between demand and supply of various products, students also consider hidden costs.
Curated OER
Stem-and-Leaf Plots
Seventh graders study steam-and-leaf plots. Given specific data, they create a stem-and-leaf plot . Students identify the mean, mode, range and median. Afterward, they review vocabulary words.
Curated OER
Youth vs. Adult Employment
Learners investigate the unemployment rate in Canada. In this statistics lesson plan, students collect data on youth finding jobs, graph and analyze the data. This assignment raises awareness of the employment problems in Canada.
Curated OER
Pounds of Paper
In this collecting of data worksheet, 2nd graders study and analyze a pounds of paper table in order to solve and answer 6 mathematical questions.
Curated OER
Watch the Birdie
In this data table worksheet, students solve 6 word problems in which information about birds on a data table is used to answer each question.
Curated OER
Keeping Track
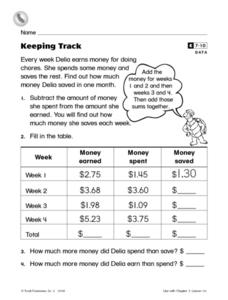
For this data table worksheet, learners complete a table with information on money earned, spent and saved in each of 4 weeks for a student's job.
Curated OER
Y-Intercept and Slope Intercept Form
Alegebra amateurs identify the slope and the y-intercept given a linear equation in slope-intercept form by correctly completing some in class problems. They write the linear equation in slope-intercept form that corresponds to the given...
Curated OER
Water Fun
Students examine uses for water. In this water lesson, students discuss how they use water. As a class students make a PowerPoint by naming one swimming safety rule. Students compare and contrast fishing for fun and fishing for survival.
Curated OER
The Election Connection
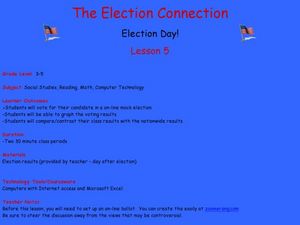
Learners participate in a mock election. In this election activity, students vote online in a mock election, graph the results, and compare their results to the nationwide results.
Curated OER
Apple Logic and Problem Solving
Young scholars examine apple production in the United States. In this interdisciplinary lesson, students use problem solving strategies introduced to solve math problems associated with apple production in the United States. Student...
Curated OER
Heads or Tails?
In this probability worksheet, 1st graders toss a penny in the air 5 times and fill in a chart on how many times it landed heads up and/or tails up. Students complete this activity three times.
Curated OER
Launching Rockets
Second graders discuss experiences of watching a rocket launch either on television or in person before making paper rockets. They make and color rockets which they attempt to launch using a strong breath blown through a straw at the...
Curated OER
Calculating Your Travel GHGs
Young scholars calculate the amount of greenhouse gases they produce in a given day. Using an equation, they determine the emissions for different sized vehicles and calculate the amount resulting from a family vacation. They create a...
