Virginia Department of Education
Scatterplots
Math is all fun and games with this activity! Learners use an activity designed around hula hoops to collect data. They create scatter plots with their data and then analyze the graphs for correlation.
Curated OER
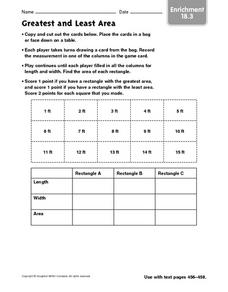
Greatest and Least Area - Enrichment 18.3
In this greatest and least area game worksheet, learners cut out the cards, draw a card and record the measurement in the length or width column of a graph. When all columns have been filled, they calculate the areas to find the winner...
Old Dominion University
Introduction to Calculus
This heady calculus text covers the subjects of differential and integral calculus with rigorous detail, culminating in a chapter of physics and engineering applications. A particular emphasis on classic proof meshes with modern graphs,...
Curated OER
Match Game: Enrichment
In this solid figures activity, students choose a shape from the box that fits the bar graph totals for the faces, edges, and vertices. Students then complete the last bar graph using the one unused shape.
Curated OER
Toy Sale- Writing Number Sentence and Using a Data Table Enrichment Worksheet
In this number sentence and data table enrichment worksheet, 1st graders write a number sentence using information from a data table to solve an equation in 4 examples.
Illustrative Mathematics
Hours of Daylight 1
The midline of the mathematical model of the number of hours of sunlight is not 12 hours. Pupils use the modeling cycle to determine a function that will model the number of hours of sunlight at a location of their choosing. Using...
Curated OER
Cricket Weather
In this collecting data worksheet, 4th graders use the data collected on crickets chirps and the temperature to make a line graph by following 4 directives.
Curated OER
Animal Runners
In this collecting data instructional activity, 4th graders use the data shown on how fast 6 animals can run to create a bar graph. Students follow the instructions on 3 directives for their bar graphs and answer 1 short answer question.
Curated OER
Measurement Enrichment Worksheet- Using Mouse Measures
In this measurement enrichment worksheet, 2nd graders use a picture of a mouse as a unit of non-standard measurement to complete a chart. They record the shortest items and longest item in 2 questions below the chart.
Curated OER
Favorite Fruit
In this graphing worksheet, 1st graders create a bar graph showing the favorite fruits of their classmates. They analyze their bar graph by answering five comprehension questions.
Illustrative Mathematics
Medieval Archer
This activity presents a problem about a computer game which uses functions to simulate the path of an arrow fired by an archer. Learners use the given function to determine where the archer must stand in order to fire an arrow that will...
Curated OER
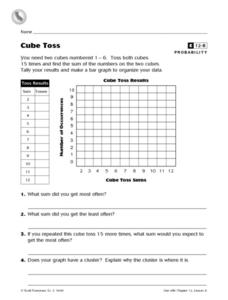
Cube Toss
In this probability and graphing learning exercise, students solve 8 problems in which data from a cube toss is displayed on a table and graph. Students answer the questions about their results.
Curated OER
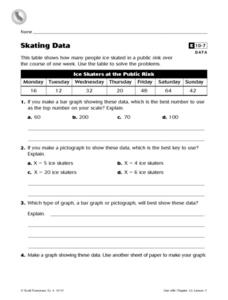
Skating Data
In this collecting data activity, 4th graders view a table on ice skaters at a public rink in order to answer 2 multiple choice questions, 1 short answer question and make a graph showing one piece of the data.
Curated OER
Chances And Tallying
In this graphing worksheet, 2nd graders use tally marks for a coin toss. Students respond to 5 questions about their chart and outcomes.
Curated OER
Double Data
In this data worksheet, students answer 4 questions about a double line graph. For example, "How can you use the graph to figure out when each alligator grew the most?"
Curated OER
Classy Fractions
In this fractions worksheet, students find the total numbers of students in their class and ask each student 7 questions provided. Students make a tally chart to record the responses and calculate the fraction of the class that answered...
Curated OER
Make a Pictograph
In this pictograph activity, 2nd graders create a pictograph involving colors they see the most often in clothing, recording marks and placing those marks in three boxes labeled red, blue and green. Students cut out squares for each 5...
Curated OER
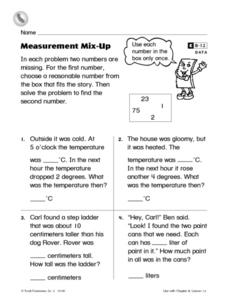
Measurement Mix-Up
In this measurement worksheet, 2nd graders read 4 word problems and find the two numbers missing in each one. Students choose a reasonable number from the box that fits the story for the first number and then solve the problem to find...
Curated OER
Picture This
In this shapes worksheet, 2nd graders look at 9 lettered pictures within a grid and copy each shape in the correct lettered box in the second grid. Students write down what they see in a complete sentence.
Curated OER
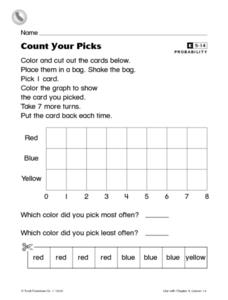
Count Your Picks
In this probability worksheet, students cut out 3 color cards and place them in a bag. Students pick a card out of the bag 8 times, putting the card back each time. Students record their results on a bar graph.
Curated OER
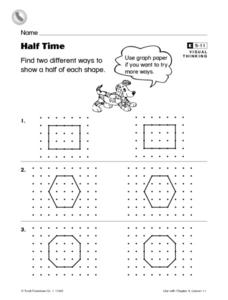
Half Time
In this shapes activity, 1st graders study and analyze how to cut three different shapes on dotted lines in half, two different ways on each line.
Curated OER
Pounds of Paper
In this collecting of data worksheet, 2nd graders study and analyze a pounds of paper table in order to solve and answer 6 mathematical questions.
Curated OER
Watch the Birdie
In this data table worksheet, students solve 6 word problems in which information about birds on a data table is used to answer each question.
Curated OER
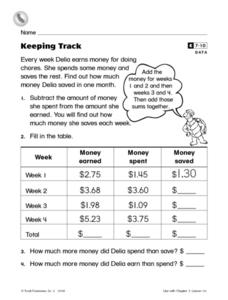
Keeping Track
For this data table worksheet, learners complete a table with information on money earned, spent and saved in each of 4 weeks for a student's job.

