Curated OER
Circle Graphs
Sixth graders interpret, create, and display data in a circle graph. In this circle graph lesson plan, 6th graders use a compass, protractors, pizza boxes, and more to create a circle graph and analyze the data they put into it.
Curated OER
Calculating The Poverty Line
Students examine the poverty line. In this poverty line lesson, students discover what the poverty line is and how the U.S. government determines it. Students calculate alternative poverty lines and examine their implications.
Curated OER
Stone Fox and Economics
Pupils read the novel Stone Fox and review economic concepts including income, goods, and services. They define the following terms: capital, credit, credit risk and summarize their reading by reading several chapters at a time. They...
Curated OER
Bubble Gum Chemistry
Students explore the concept of graphing data. In this graphing data lesson, students determine the percentage of sugar in bubble gum. Students graph type of gum vs. sugar percentage. Students create a table of their data.
Curated OER
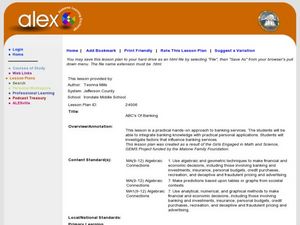
ABC's of Banking
Students explore the concept of managing money. In this managing money instructional activity, students discuss how to write checks and keep an accurate check registry. Students discuss the importance and uses of debit cards and deposit...
Curated OER
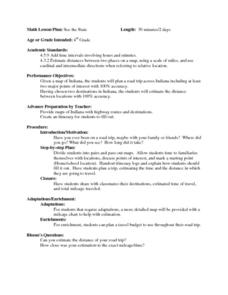
See the State
Fourth graders are given a map of Indiana and have to plan a road trip including at least two major points of interest with 100% accuracy. The students estimate the distance between their two chosen locations with 100% accuracy.
Alabama Learning Exchange
Alex: "All in the Family"
A cooperative unit where students work together and use a variety of math skills to establish budgets and compare and compute the best buys. Students will continue practicing their writing skills by writing thank you notes to local...


