Curated OER
Area "FOILed" Again!
Learners perform factoring on the TI. In this algebra lesson plan, students factor equations using the FOIL method. They use the TI navigator to show each step using a visual.
Curated OER
A Class Census
Students recognize that data represents specific pieces of information about real-world activities, such as the census. In this census lesson, students take a class and school-wide census and construct tally charts and bar graphs to...
Curated OER
Properties of Parabolas
Learn to identify the properties of parabolas. Students define parabola as the locus of all points equidistant from a fixed point and a fixed line. Also, interpret the equation for a parabola in vertex form and gain a visual...
Curated OER
Exploring Complex Roots
In exploring the concept of complex roots, students find the axis of symmetry and roots of parabolas. Then, they discuss what makes a solution complex and how to identify functions with complex roots.
Curated OER
Exploring Quadratic Equations
By stretching and translating the parabola given and determining the effects on the equation, students explore finding the vertex and zeros of a parabola and relate them to the equation. Students also view the intercept form to determine...
Curated OER
Congruent Triangles
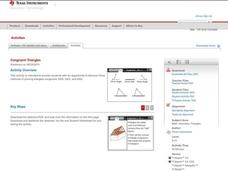
Students identify properties of triangles. In this geometry lesson, students differentiate between similar and congruent triangles. They use the umber of sides to help define the angle of the polygon.
Curated OER
Aruba Cloud Cover Measured by Satellite
Students analyze cloud cover and to compose written conclusions to a given related scenario. They submit a letter of response and a report detailing their calculations and conclusions.
Curated OER
A Statistical Look at Jewish History
Students complete their examination over the Jewish Diaspora. Using population figures, they discover the importance of percentages in exploring trends. They use their own ethnic group and determine how it is represented in the United...
Curated OER
The Dog Days of Data
Learners practice an alternative form of data presentation. They practice sequencing data, identifying the stem-and-leaf, creating stem-and-leaf plots, and drawing inferences from the data by viewing the plots.
Curated OER
The Dog Days of Data
Young scholars are introduced to the organization of data This lesson is designed using stem and leaf plots. After gather data, they create a visual representation of their data through the use of a stem and leaf plot. Students...
Curated OER
Boxplots Introduction
Students describe the pattern of a bell curve graph. In this statistics lesson, students move data around and make observation about the mean, and the quartiles. They define boxplot, outlier, range and other important vocabulary words...
Curated OER
What is a P-value?
Students test the hypotheses using p values. In this statistics lesson, students define and examine conditional probability. They test each statement for a true statement or a false statement, based on the sample size.
Curated OER
Meaning of Alpha
students define the alpha level. In this statistics activity, students identify what makes the "null rejected" and discuss the data surrounding the null. They observe the meaning of alpha as it relates to the bell curve.
Curated OER
High Exposure
Pupils interpret data they receive from the media, discuss possible misinterpretation of data from the media and correctly respond to the misconception quiz question.
Curated OER
Data Shuffle
Middle schoolers find an advertisement or newspaper using charts or graphs. They create another graph using the same information in a different format. They write a comparison of the two graphs.
Curated OER
School Climate, Where Are We Now?
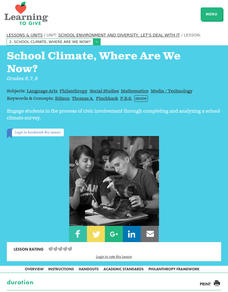
Students complete a school climate survey. They analyze the results and decide on an area of need in the school. They recommend a plan of action and complete it.


