Hi, what do you want to do?
McGraw Hill
Glencoe: Self Check Quizzes 1 Frequency Tables
Use Glencoe's randomly generated self-checking quiz to test your knowledge of frequency tables. Each question has a "Hint" link to help. Choose the correct answer for each problem. At the bottom of the page click the "Check It" button...
Khan Academy
Khan Academy: Creating Frequency Tables
Practice creating frequency tables from small data sets. Students receive immediate feedback and have the opportunity to try questions repeatedly, watch a video or receive hints.
Khan Academy
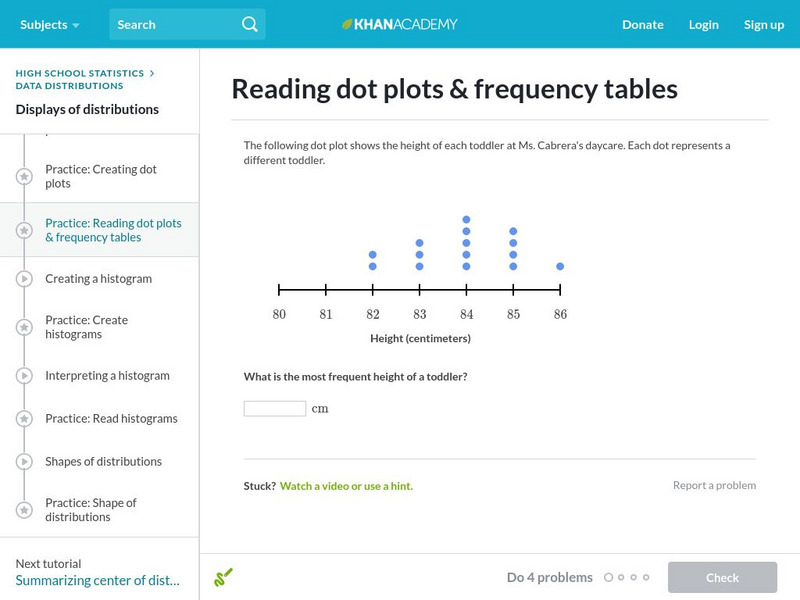
Khan Academy: Reading Dot Plots & Frequency Tables
Practice reading basic dot plots and frequency tables. Students receive immediate feedback and have the opportunity to try questions repeatedly, watch a video or receive hints.
Khan Academy
Khan Academy: Reading Dot Plots and Frequency Tables
In this exercise, students practice reading dot plots and frequency tables. Students receive immediate feedback and have the opportunity to get hints and try questions repeatedly.
Khan Academy
Khan Academy: Two Way Relative Frequency Tables
Practice creating two-way relative frequency tables from a two-way frequency table. Students receive immediate feedback and have the opportunity to try questions repeatedly, watch a video, or receive hints.
Khan Academy
Khan Academy: Creating Frequency Tables
In this exercise, students practice creating frequency tables. Students receive immediate feedback and have the opportunity to get hints and try questions repeatedly.
Khan Academy
Khan Academy: Two Way Frequency Tables
Given a Venn diagram or information about a relationship, create a two-way frequency table. Students receive immediate feedback and have the opportunity to try questions repeatedly, watch a video, or receive hints.
Khan Academy
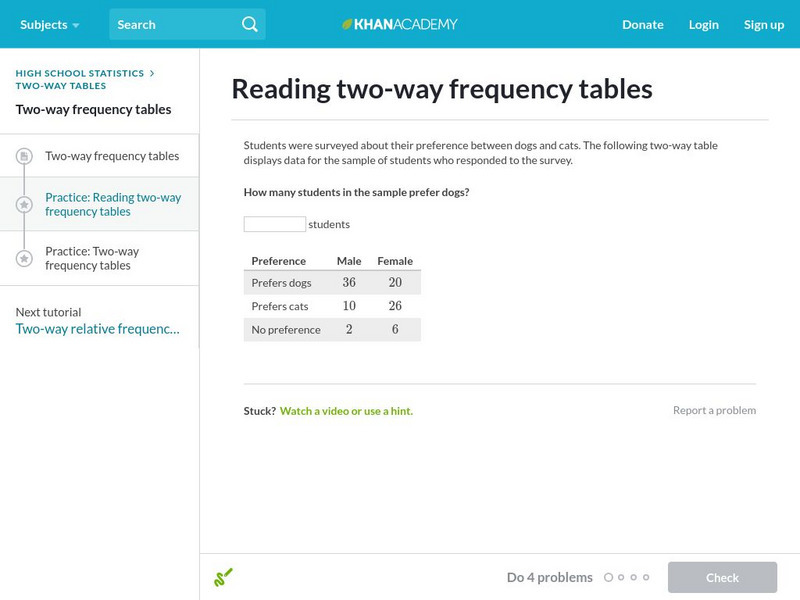
Khan Academy: Reading Two Way Frequency Tables
Practice interpreting two-way frequency tables. For example, what does the cell in the top left tell you? Students receive immediate feedback and have the opportunity to try questions repeatedly, watch a video, or receive hints.
Khan Academy
Khan Academy: Reading Two Way Relative Frequency Tables
Practice interpreting two-way relative frequency tables Students receive immediate feedback and have the opportunity to try questions repeatedly, watch a video or receive hints.
Khan Academy
Khan Academy: Two Way Relative Frequency Tables and Associations
A set of three problems where students fill in a relative frequency table, read the information in it and look for a relationship between the variables. Answers are accompanied by explanations.
Oswego City School District
Regents Exam Prep Center: Practice With Organizing and Interpreting Data
Several problems are presented to test your skills in creating and interpreting frequency tables, pie charts, box-and-whisker and stem-and-leaf plots.
Khan Academy
Khan Academy: Calculating the Median: Data Displays
Practice computing the median of data sets presented in a variety of formats, such as frequency tables and dot plots. Students receive immediate feedback and have the opportunity to try questions repeatedly, watch a video or receive hints.
E-learning for Kids
E Learning for Kids: Math: Tea Store: Reading a Table
Students will demonstrate how to interpret information in a table.
Louisiana Department of Education
Louisiana Doe: Louisiana Believes: Eureka Math Parent Guide: Collecting and Displaying Data
A guide to support parents as they work with their students in collecting and displaying data.
BBC
Bbc: Bitesize Revision: Data Handling: Mean
Need the basics on how to find a mean? Interactive examples are available that help you find the mean using data from a frequency table. You can also enter your own data and find the mean. You will find plenty of guided practice and...
McGraw Hill
Glencoe: Online Study Tool: Quiz on Measures of Variability
Students demonstrate advanced mathematics skills with this online quiz. The questions check understanding on measures of variability. Topics include variance, standard deviation, and frequency tables.
Math Is Fun
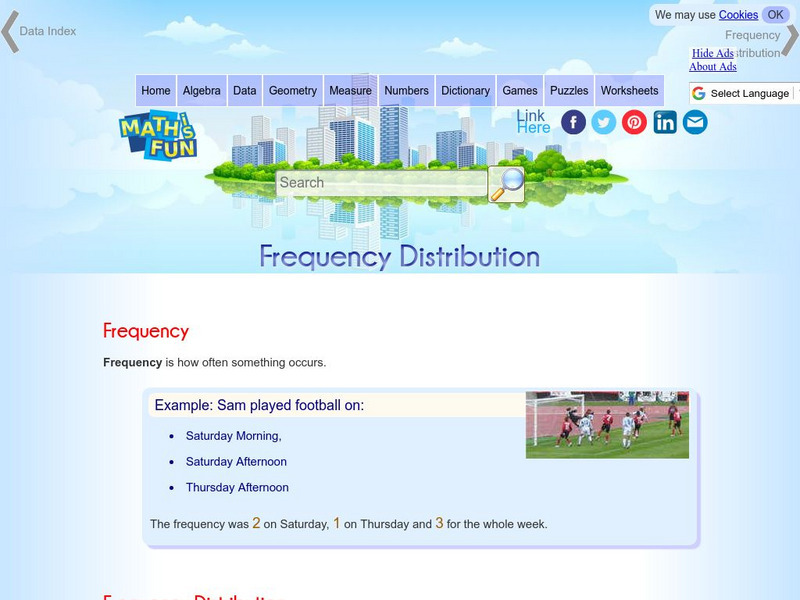
Math Is Fun: Frequency Distribution
Explains, with examples, what a frequency distribution table is. Includes a set of practice questions.
Quia
Ixl Learning: Histograms
Brush up on your math skills relating to histograms then try some practice problems to test your understanding.
Khan Academy
Khan Academy: Creating Dot Plots
Practice creating dot plots. Dot plots are very similar to frequency tables, but they make it easier to see the data. Students receive immediate feedback and have the opportunity to try questions repeatedly, watch a video or receive hints.
National Council of Teachers of Mathematics
Nctm: Figure This: How Much Time Do Teens Spend on the Job?
Try this math challenge where you investigate the average number of hours teen actually spend working. Apply your problem solving, number sense, and computation skills in this one page activity from the NCTM Math Challenges for Families...
Other
Bowling Green St Univ: Introduction to Probability
This site from Bowling Green State University provides an introduction to probability. It discusses topics and activities such as interpreting odds, listing all possible outcomes (the sample space), basic probability rules, equally...
Oswego City School District
Regents Exam Prep Center: Categorizing Data
Three lessons on different types of data (qualitative, quantitative, univariate, bivariate, biased data) as well as a practice activity and teacher resource.
Khan Academy
Khan Academy: Comparing Data Displays
Practice interpreting and comparing dot plots, histograms, and box plots. Students receive immediate feedback and have the opportunity to try questions repeatedly, watch a video or receive hints.
University of Illinois
University of Illinois: Rollin' Rollin' Rollin'
This resource is the beginning of a series of pages that demonstrates the diffference between the mean and median of a group of numbers. Uses bar graphs to display the data.


