Curated OER
Histograms and Bar Graphs
Students examine the use of bar graphs and histograms. In this data representation lesson plan, students investigate the proper use of bar graphs and histograms to represent data. They learn the proper geometric definitions, experience...
Curated OER
Info. From a Graph
In this graphing instructional activity, high schoolers answer 13 questions about 3 graphs. Students determine the degree, roots, y-intercepts, inflection points, multiplicity, etc. of three different graphs.
Curated OER
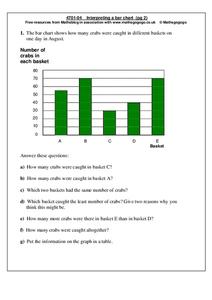
Interpreting a bar chart
In this bar chart worksheet, students analyze a bar chart and answer 7 questions pertaining to the information on the chart. The answers are on the second page.
Curated OER
Graphing It Out
Students create bar graphs. In this graphing lesson, students explore the concepts of net pay, gross pay, income and expenses. They create a bar graph to designate financial outlay during a specified period.
Curated OER
Circle Graphs
Fifth graders explore to find the central angle and percent. In this circle graph lesson, 5th graders use formulas to calculate the central angle and a protractor to create their graph. Students complete a graphing sheet for homework.
Curated OER
Graphs of Quadratic Functions
In this quadratic function worksheet, students solve and graph quadratic functions. Functions contain both positive and negative integers, fractions, and perfect squares. Graph paper is located below each equation. There are 36...
Raytheon
Equations and Graphing Review
In this equations and graphing review instructional activity, learners write, graph and solve equations for 62 problems, including a mid-unit review, with answers included.
Curated OER
Graphs
In this graphing worksheet, 9th graders read one page of graphing examples and complete 8 exercise problems. Each problem involves graphing and coordinates.
Curated OER
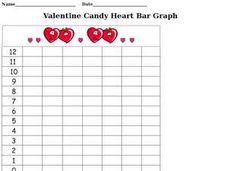
Valentine Candy Heart Bar Graph
In this Valentine candy heart bar graph worksheet, students complete a bar graph illustrating how many different colored candy hearts they received for Valentine's Day.
Raytheon
Graphing: Slope
For this slope worksheet, students complete problems having to do with slope including adding integers, graphing, finding ordered pairs, and more. Students complete 55 problems.
Curated OER
Math Who Am I?
In this math vocabulary worksheet, students read each description of a math term and write the word on the blank line. They circle every third letter in each letter box next to the clue to check their answer. They complete 8 definitions.
Curated OER
Sunshine Math-1
In this math skills worksheet, students answer 7 questions in which they use various basic math skills. They use number lines, charts, number blocks, a calendar and a ruler to complete this worksheet.
Curated OER
A Sum of Functions
Collaborative learners will see the geometric addition of functions by graphing the sum of two graphed curves on the same coordinate plane. This task then naturally flows into giving learners the algebraic representation of the curves...
Jude Mphoweh
Coordinates
This coordinate graphing lesson gives your young graphers practice graphing points on these rectangular coordinate grids.
Sinclair Community College
Solving Linear Inequalities
Your learners will appreciate the complete picture of linear inequalities presented in this lesson plan. Starting simply with definitions and moving all the way to solving linear inequality word problems this activity is simple to...
Wordpress
I Can Find Slope
Your young mathematicians will appreciate this wonderfully organized summary and explanation of linear slope. Approaching slope as it looks in a table of values, on a graph, in an equation, and between two points, this note sheet is...
Curated OER
Agriculture and the Government
Students study the government's involvement in the U.S. A's food production and make connections relating to farm programs. For this historical agriculture lesson, students read content and research significant information....
Curated OER
Pre-Calculus Review Sheet
Pre-Calculus has some detailed formulas involved and here is a great resource that lumps then all together for you. Broken up into rectangular, polar, and parametric sections, the conics all include formulas and graphs.
Curated OER
Games on Echolocation
Get a little batty with life science! This fun simulation game replicates how bats use echolocation to hunt moths in their native Hawaiian habitat. After creating blind folds and discussing some basic principles of echolocation, students...
Curated OER
Statistics for Graphing
Students use the Internet to access a variety of websites that present statistics and information for use in graphing. They represent sports statistics, geographical measurements, temperatures and more.
Curated OER
Graphs to Represent a Data Set
Here are the number of animals Jackson saw at the zoo; scholars organize data into bar graphs using this learning exercise. Encourage labeling, but consider having scholars do these on another sheet because there isn't room for the...
Curated OER
Best-Selling Books Bar Graph
Create a bar graph with your elementary school learners. First they read and interpret data, and then they color in the graph (provided) to indicate how many of each were sold. Consider providing them with the data but having them...
Curated OER
Popcorn Math
Everyone loves popcorn! Use this treat to teach math concepts including place value, estimating, graphing, and volume. Eight possible activities are included, and they can be modified to fit all grade levels.
Curated OER
Have You Looked Outside? Lesson #5- Graphing Weather Conditions
First graders study daily weather changes. In this weather and graphing lesson, 1st graders chart the daily weather for a month using stickers or weather symbols. They graph the weekly weather so that at the end of the month students...
Other popular searches
- Charts and Graphs Math
- Hidden Picture Math Graphs
- Misleading Graphs Math
- Powerpoint Math Graphs
- 1st Grade Math Graphs
- Math Graphs 4th Grade
- Math Reading Graphs
- Animals Math Graphs
- Math Graphs Grade 1
- Creating Math Graphs
- Math Graphs Using M&ms
- Math Interpreting Graphs


