Curated OER
Identify and Graph Linear Equations
Students investigate linear functions. For this mathematics lesson, students plot points onto a graph by solving the equations y=x and y=mx+b by being given numbers for x and solving for y.
Curated OER
Graphing Greenery
Students gather leaves and trace them on graph paper. They plot coordinates that approximate the shape of the leaves and share those coordinates as "worksheets" for other students to complete.
Curated OER
Introduction to Graphs
Learners poll classmates to gather information for a graph. They identify three types of graphs (bar, line, table). Students create each type of graph using data gathered from classmates.
Curated OER
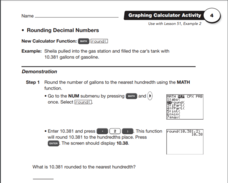
Rounding Decimal Numbers: Graphing Calculator Activity
In this math learning exercise, students use graphing calculators to complete a total of three problems with rounding decimal numbers. Diagrams are included in student instructions.
Curated OER
Graphing Linear Equations with Two Variables
Can your class solve linear equations in two variables? They will be able to after they engage in this lesson. Individuals graph linear equations in two variables using slope and intercept and identifying the relationship between the x...
Curated OER
Graphing Quadratic Equations with a Coefficient of One
This is a teacher page for a lesson and does not include any materials to support the lesson. Students graph quadratic equations with a coefficient of one and create a table of values to graph a quadratic equation. They plot the values...
Curated OER
Linear Functions: Slope, Graphs, and Models
This math packet provides an opportunity for learners to graph two linear equations on a coordinate grid and determine the slope and y-intercept of each. They use the equation of five lines to find the slope and y-intercepts, and then...
Curated OER
Graphing Calculator Activity: Multiplying and Dividing Mixed Numbers
In this graphing calculator worksheet, students explore necessary steps to multiply and divide mixed numbers using a graphing calculator. In groups, students measure objects in their classroom and write equations using their collected...
Illustrative Mathematics
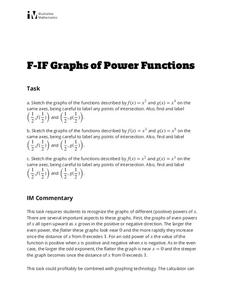
Graphs of Power Functions
This activity consists of three exercises in which learners sketch the graphs of various power functions on the same axes. They use their sketches to make comparisons and observations which lead to generalizations about the graphs...
Curated OER
Graphing Our Snacks
Students gather information from Nutrition Facts labels on their favorite snack foods. They graph the fat content of the foods and reflect on what they see.
Curated OER
Impossible Graphs
Young scholars practice plotting functions on the Cartesian coordinate plane while participating in a discussion about the Possible Or Not worksheet/activity. Students also use the Impossible Graphs worksheet to practice reading a graph,...
Curated OER
Choose The Appropriate Graph
Fifth graders work in groups to investigate the proper use of a graph during a schoolyard ecology project. The challenge of the project is for students to choose the proper form of a graph. They gather data and conduct analysis with the...
Curated OER
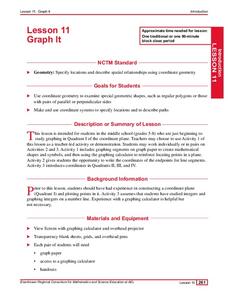
Graph It
Elementary and middle schoolers engage in a lesson of graphing in quadrant I of the coordinate plain. They use the graph to create shapes and symbols. While using a graphing calculator, they locate the points on the coordinate plane. In...
Curated OER
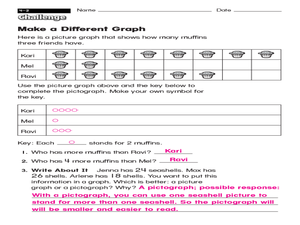
Make a Different Graph
What is the difference between a picture graph and a pictograph? Young learners are given a picture graph detailing how many muffins three friends have, and they must complete a pictograph using a symbol of their choice. An answer key is...
Curated OER
Graphing on the Computer
Students create a bar graph on the computer using given information from the teacher. They create a bar graph using their own information chart (they need to create one on separate paper first). They utilize Microsoft Excel for this...
Curated OER
Senior Analysis: Graphing Rational Functions
Budding mathematicians graph given functions, identify the asymptotes, graph absolute values, and write a table of points. This three-page instructional activity contains 23 problems.
Curated OER
Graphing Quadratic Equations
Review the form of a quadratic function, and the parabola it creates. Continue on with the whole group to work through a mini-lab, practicing how to graph quadratic equations with one variable. The goal of this lesson is for the group...
Curated OER
Graphing And Data Presentation
Students engage in a study of science and mathematics with the practice of creating graphs. A guest speaker comes to the class to share statistics from the community and the students are shown how he uses the coordinate system in the...
Curated OER
Probability Experiment Simulation: Design and Data Analysis Using a Graphing Calculator
Seventh graders simulate probability experiments. Using a graphing calculator, 7th graders design, conduct, and draw conclusions from simulations or probability experiments. Students construct frequency tables and compare the...
Curated OER
Graphing and Interpreting Linear Equations in Two Variables
Graph linear equations using a table of values. Learners solve equations in two variables using standard form of an equation. They identify the relationship between x and y values.
Curated OER
Fun with Math using Magnetic Force
Sixth graders explore and discuss the effectiveness of magnets in different situations. In this math instructional activity, 6th graders discuss rate and graphs after exploring with magnets using different restrictions on the magnets....
Curated OER
Graph Frenzy!!
Students brainstorm for a survey question to ask classmates. They survey their classmates. They enter the results into a spreadsheet and create the best graph for the information. They share their graphs with the class.
Curated OER
Play Battleship on Graph Paper
Who says learning can't be enjoyable? Your class will love identifying the x axis and y axis of a coordinate plane and plotting various points when it's dressed up in the guise of a Battleship game. Rather than sets of the actual game,...
Shodor Education Foundation
Graphing and the Coordinate Plane
Ready to introduce your class to the coordinate plane? This website includes a detailed lesson plan that includes two interactive games to help learners practice graphing ordered pairs. The scripted discussion is a little cheesy and a...
Other popular searches
- Charts and Graphs Math
- Hidden Picture Math Graphs
- Misleading Graphs Math
- Powerpoint Math Graphs
- 1st Grade Math Graphs
- Math Graphs 4th Grade
- Math Reading Graphs
- Animals Math Graphs
- Math Graphs Grade 1
- Creating Math Graphs
- Math Graphs Using M&ms
- Math Interpreting Graphs


