Curated OER
Making Circle Graphs
Seventh graders engage in the practice of a Math lesson. Students practice the use of circle graphs in class and on homework as an extension. The lesson includes a classroom management portion. The assignment for the lesson is for the...
Curated OER
Graphing Trigonometric Functions
The student should be able to transfer his knowledge of graphing functions to graphing trigonometric functions. Student should be able to graph trigonometric functions, find amplitude, period, and frequency.
Curated OER
Square Roots, Number Classification, Ordering & Graphing
Ninth graders identify numbers as rational or irrational. Using calculators estimation, and factoring methods, 9th graders compute the square root of numbers. They graph numbers in sequential order and round numbers integers to the...
Curated OER
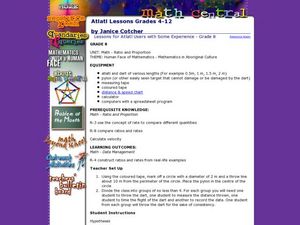
Atlatl Lessons for Grade 8
Eighth graders explore the weapons of the Aboriginal people. In this eight grade math/science lesson, 8th graders collect and analyze data regarding the speed and distance of a dart thrown with an atlatl. Students choose the...
Curated OER
New York State Testing Program: Mathematics Book 2, Grade 3
In this 3rd grade math standardized test practice worksheet, 3rd graders solve 6 multiple-step open-ended math problems based on New York academic standards.
Curated OER
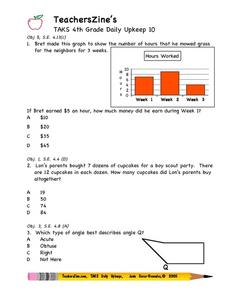
TAKS 4th Grade Daily Upkeep 10
In this math worksheet, 4th graders look for the answers to basic review problems that focus upon the skills of reading simple word problems, and applying the interpretation of data.
Curated OER
Junk Food Math
Students use Skittles candies as they explore estimation and percentages. In this math lesson plan, students sort, count, and chart Skittles candies to learn about estimation and study percentages.
Curated OER
ExplorA-Pond:4th Grade Surface Area
Fourth graders estimate the surface area of a pond using the chance method and the estimation method. They complete a graph and a short report comparing the results of the two methods.
Curated OER
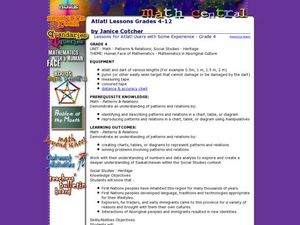
Atlatl Lessons for Grade 4
Fourth graders explore the weapons of the Aboriginal people. In this fourth grade math lesson, 4th graders create charts, tables, or diagrams to represent patterns and relations. Students investigate which dart length has the...
Curated OER
Different! Diverse! Dynamic! Lesson 1: Late Bloomers
Students examine how people grow and mature at different rates. They create a graph and a timeline to organize the data they collect.
Curated OER
Fun Creative Activities that Teach Math
Students have fun with math. In this math skills lesson, students collaborate to solve the problems presented in this interactive lesson. The problems pertain to geometry, measurement, probability, number sense, and algebra.
Curated OER
Algebraic Relationships
Here are 17 various forms of problems that range from matching equivalent expressions to word problems. Included are problems for substutiing values into expressions and using the order of operations, simplifying algebraic expressions,...
Curated OER
Math: Football Fever Fun
Students compile statistics from high school or other football team and construct a spreadsheet on which to record their findings. Using Chart Wizard to analyze the data, they construct charts and graphs for a visual display of the...
Curated OER
Arrange the Classroom (Part 1 of 3)
Fifth graders arrange the classroom using all the moveable objects and through the exploration of area and perimeter. They determine the area of the classroom, create and label model pieces of furniture using graph paper, and create a...
Curated OER
Atlatl Lesson Grades 4-12
Tenth graders explore the weapons of the Aboriginal people. In this tenth grade mathematics activity, 10th graders investigate how throwing with an atlatl increase the speed of the dart as it is thrown. Students calculate the speed for...
Curated OER
Graphing Favorite Fruit
Third graders take poll and sort data, enter the data to create a spreadsheet and create bar and pie graphs.
Curated OER
Reading the Neighborhood
First graders complete activities with the story One Monday Morning in the Macmillan/McGraw Hill Textbook. In this data lesson, 1st graders read the story and gather data to create a picture graph. They read the graph and answer...
Curated OER
Decisions, Decisions, Decisions
Students examine graphs to find the most appropriate for various kinds of data. In this graphing lesson, student create bar, line and circle graphs. Students create graphs electronically and manually interpreting the data.
Curated OER
How Do You Like Your Eggs?
First graders conduct a poll about how people like their eggs. In this graphing lesson, 1st graders collect data about how they like their eggs. Students use a picture of themselves to place under the type of egg they like. Students then...
Curated OER
Which Amusement Park Would You Choose?
Students analyze data related to amusement parks and create a spreadsheet to display the data. They read the data and predict which amusement park they think is safer, create a spreadsheet and graph, and write a proposal based on their...
Curated OER
Step Into My Shoes
Students order their classmates from smallest to largest foot length. In this ordering their classmates from smallest to largest foot length lesson, students trace each of their classmates foot. Students read a story called,...
Curated OER
Dealing with Data
Seventh graders collect and analyze data. In the seventh grade data analysis lesson, 7th graders explore and/or create frequency tables, multiple bar graphs, circle graphs, pictographs, histograms, line plots, stem and leaf plots,...
Raytheon
Data Analysis and Interpretation
For this data analysis and interpretation worksheet, learners use charts, graphs, statistics to solve 42 pages of problems with answer key included.
Curated OER
Analyze This
Students gain practice in the analysis of various types of graphs common in daily life. These examples often use graphic images like charts, graphs, tables, and pictures to supplement learning.


