EngageNY
An Experience in Relationships as Measuring Rate
Compare the ratio of genders in classes with a lesson that revisits ratio terminology. After finding the ratio of boys and girls, the class then finds the time it takes to pass out papers and determines the associated rates.
NOAA
Tracking a Drifter
Be shore to use this drifter resource. The third installment of a five-part series has learners using the NOAA's Adopt-a-Drifter website to track to movement of a drifter (buoy) in the ocean. Graphing the collected data on a map allows...
Curated OER
Creating a Thematic Map
Students create and analyze a weather-related data table and a thematic map based upon information provided.
Mathematics Assessment Project
Middle School Mathematics Test 4
Raise expectations in your classroom and assess learners through the provided performance tasks. Class members must apply concepts learned throughout the year, providing a good measurement of how well they understand the...
Mathematics Assessment Project
Middle School Mathematics Test 5
A middle school test contains two 40-minute sections covering material through algebra. All questions involve applied problem solving or mathematical analysis.
Curated OER
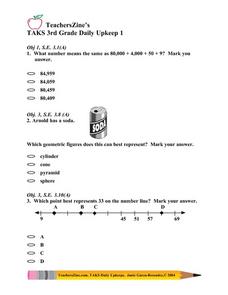
TAKS 3rd Grade Daily Upkeep 1
In this TAKS worksheet, 4th graders answer three multiple choice questions that pertain to objectives covered on the Texas state test. Students answer quesetions regarding geometric figures andplotting on a numberline.
Curated OER
Interactivate - Lines, Rays, Line Segments, and Planes
Students explore lines, rays, line segments, and planes. In this math instructional activity, students discuss the math concepts and direct their instructor in graphing functions. Students collaborate in graphing additional functions.
Curated OER
Finding Your Pulse Rate
Fifth graders demonstrate how to find their pulse and count the beats after a certain amount of time. In cooperative pairs, 5th graders use a stopwatch to keep track of their partner's heart rate in seconds. Pairs make a graph from their...
Curated OER
Finding Equations
Students make equations from everyday data. They create a graph from the equations. Students predict and analyze the results. Students complete the second scenario on their own and turn in their handout.
Curated OER
Raisin the Statistical Roof
Use a box of raisins to help introduce the concept of data analysis. Learners collect, analyze and display their data using a variety of methods. The included worksheet takes them through a step-by-step analysis process and graphing.
Curated OER
Modeling Linear Relationships
Students graph lines using the slope and y-intercept. In this algebra lesson, students create data using tables and equations. They use their data to make predictions and draw conclusion.
Curated OER
Does Sunlight Effect Leaf Size?
Students make estimates and then measure leaves for accuracy. They calculate the area of the leaves by drawing an outline on graph paper and counting the squares. They compare the leaves exposed to sunlight to those that are in constant...
Curated OER
Representation of Quadratic Functions
Students use a table, graph or equation to represent a quadratic function. In this algebra lesson, students model and graph with quadratic function. They become comfortable representing quadratics using different methods.
Curated OER
Geometric Figures-Triangles
Fourth graders explore triangles. In this math lesson, 4th graders discuss the different types of triangles. Students create triangles using wiki sticks. Students complete an online matching game.
Curated OER
Highs and Lows
Plot data using the number line and discuss how negative numbers are used in math and science. Sixth and seventh graders share their graph with the class and provide an explanation for their plotting.
Curated OER
Using Negative Numbers
Fourth graders explore negative numbers with this resource. They discuss positive and negative numbers by counting who is present and absent, placing numbers on a number line, and graphing temperatures. Using a variety of activities,...
Curated OER
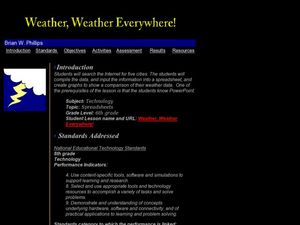
Weather, Weather, Everywhere!
Sixth graders collect weather data to compare temperatures around the world. Using the Internet, learners collect data, put it into spreadsheets, and analyze and graph the results. An interesting way to cover the topic of weather.
Curated OER
Ready for Roots
Fourth graders sort seeds and predict what conditions are needed for them to germinate. They keep the seeds moist, observe and measure their growth and graph the results. As the seeds start to grow students compare and contrast the each...
Curated OER
Four Quadrant Grid
Use this math activity to have your charges engage in positive and negative numbers for math coordinate graphing purposes. There are no questions on the page which is labeled for grade 5.
Alabama Learning Exchange
Systems on a Mission
Solve systems of equation problems using four different methods: elimination by addition or subtraction, graphing, elimination by multiplication, and substitution. Middle schoolers are then given a series of "missions" to complete.
Curated OER
Off to College
High schoolers investigate linear, quadratic and exponential equations using the TI calculator. They identify relation and functions using ordered pairs, graph the data, analyze the data, and relate it to real-world situations.
Curated OER
Newport Weather Project
Students study weather and climate patterns using computer and Internet resources. They collect temperature information and share it with other classes via e-mail using graphs
Curated OER
Data Lesson Vital Information
Students prepare and collect data and use excel and create a graph. They collect data about the number of pattern blocks that are put on tables. Students then record that data in Excel.
Curated OER
What's Your Shoe Size? Linear Regression with MS Excel
Learners collect and analyze data. In this statistics lesson, pupils create a liner model of their data and analyze it using central tendencies. They find the linear regression using a spreadsheet.


