Curated OER
Introduce Double-Digit Addition
Students generate a list of numbers then classify them into groups of single digit and double-digit numbers. After listening to a children's book about double-digit addition, they work with tens and ones blocks to solve double-digit...
Curated OER
Why Doesn't My New Shirt Fit?
Students test Leonardo da Vinci's view of the human body by measuring various body parts using a tape measure. They create a data table and a scatter plot and then analyze and interpret the results using a graphing calculator.
Curated OER
Understanding Statistics
In this statistics worksheet, students examine and interpret pictographs and line graphs. Students analyze the provided data in order to create bar graphs, circle graphs, and box and whisker plots. The nine page worksheet accompanies a...
Curated OER
Skittles, Taste the Rainbow
Fifth graders learn and then demonstrate their knowledge of a bar and a circle graph using the classroom data. Students are given a pack of skittles candy. Students create a bar and circle graph indicating the results of the contents of...
Curated OER
The Statistics of M&Ms
Students explore the topic of statistics with M and Ms. For this math lesson plan, students use candy pieces to sort and gather information needed to create a bar graph. This lesson can be adapted to accommodate students in grades 1-12.
Curated OER
Bell Curve
Students explain normal distribution of a measurable characteristic within a group of objects. They create two graphs (one for each type of Hershey's Kiss) with increments of measurement on the X-axes and number of measurements on the...
Curated OER
The Number Line
Eighth graders investigate the order of numbers and how they are located on the number line. They also review the symbols used to compare quantities in order to decipher simple expressions and graph them on the numberline.
Curated OER
Valentine Candy Count
Students analyze a bag of Valentine candy to create a graph. In this graphing lesson, students make predictions, sort by color, record data and make a graph. Students discuss results and make generalizations. Students generate their own...
Curated OER
Transformations and Exponential Functions
Tenth graders study graphing exponential functions. In this transformations instructional activity, 10th graders apply inquiry to determine how changes to a parent function affect its graph. Students analyze transformed graphs and...
Curated OER
Slope
Students calculate the slope of a line. In this slope lesson, students use a graph, an equation or two points to help them calculate the slope of a line. They differentiate between a slope of zero and an undefined slope.
Curated OER
Cinco De Mayo
Students make a graph identifying the immigration of Mexicans to the US. In this algebra instructional activity, students practice graphing as they review different trends in immigration over the past 100 years. They interpret and...
Curated OER
Recording Frequency
First graders analyze nursery rhymes and gather data about word frequency. For this frequency lesson, 1st graders create graphs and tables. Students interpret the data.
Curated OER
Analytic Geometry
In this analytic geometry worksheet, 9th graders graph and solve 13 different types of problems that include determining whether equations are linear to matching given equations to their corresponding equation in the second column....
Curated OER
Count The Letters
Young scholars perform activities involving ratios, proportions and percents. Given a newspaper article, groups of students count the number of letters in a given area. They use calculators and data collected to construct a pie chart...
Curated OER
Battle Shapes
Fifth graders play Battleshapes which is a variation of Battleship with geometry. In this geometry instructional activity, 5th graders get a graph paper with four quadrants. They call out coordinate points and attempt to sink their...
Curated OER
Calculus Exam
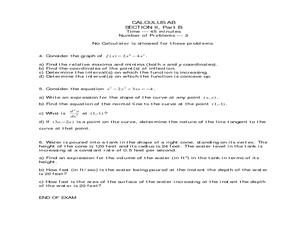
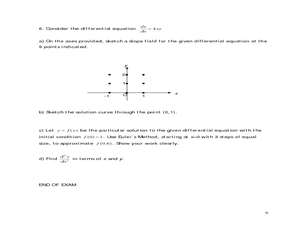
In In this calculus worksheet, student solve 6 multi-step problems involving volume, intervals, acceleration, and graphing. A graphing calculator will be necessary to complete the worksheet.
Curated OER
Slopes and Linear Equations
Students find the slopes of linear functions. In this graphing instructional activity, students analyze linear equations and calculate the slope of the line. They graph a line given the slope and y-intercept.
Curated OER
Lines in the Coordinate Plane
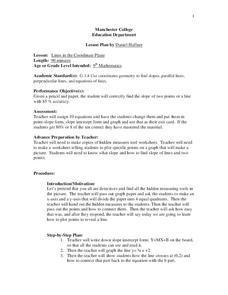
Students graph lines in a coordinate plane. In this geometry lesson, students graph lines on a coordinate plane, and identify the slope. They classify the lines as parallel or perpendicular and write an equation of a given line.
Curated OER
Three In a Row
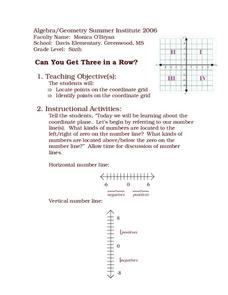
Sixth graders examine how to locate coordinate points. In this coordinate graphing lesson, 6th graders locate the x and y axis. Students use their arms to show horizontal and vertical lines, participate in group and...
Curated OER
Timed Caluculus Exam
In this Calculus activity, 10th graders have 45 minuets to solve 6 multi-step problems involving velocity, integrals, and graphing.
Curated OER
3.14159265
Students discover the value of Pi. In this value of Pi lesson, students measure the circumference and diameter of various circles on their graphing calculator. Students find the ratio of the circumference to the diameter and...
Curated OER
Mean Meadian and Mode
Students apply central tendencies to given data. In this statistics lesson, students calculate the mean, median, and mode as it relates to their data. They collect data and graph it while identifying the way the numbers are ordered.
Curated OER
Paying for Crime
Students participate in activties examining ratios and proportions. They use graphs to interpret data showing the government's budget for prisons. They present what they have learned to the class.
Curated OER
Curve Fitting and the TI-85 Calculator
Seventh graders follow a step-by-step guide for using graphing calculator to determine equations which best fit data graphed. They gather data from various sites on the web, or they do searches to find information necessary to complete...


