Curated OER
Probability
Fourth graders perform probability experiments. In this math lesson, 4th graders complete a penny toss to evaluate and graph the combinations of outcomes. In a second activity, students draw M&Ms out of a bag and graph results. In a...
Curated OER
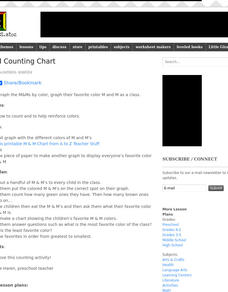
M & M Counting Chart
Students create an individual M&M's graph based on the number of each color of candy pieces in their handful of candy. They graph the favorite color of the whole class while practicing counting and color identification.
Curated OER
Smarty Pants
Learners graph the colour distribution found in a packet of Skittle lollies, M&M's, Smarties or similar sweets. Results are compared and recorded against the results of other class members.
Curated OER
M & Ms in a Bag
Young scholars make predictions about the number and colors of M&M's in a snack size package. They create an Excel spreadsheet to record the data from their small group's bag, create a graph of the data, and discuss the variations...
Curated OER
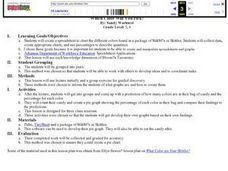
Which Color Will You Pick?
Students create a spreadsheet to chart the different colors found in a package of M&M's or Skittles. They collect data, create appropriate charts, and use percentages to describe quantities.
Curated OER
Teaching Radioactive Decay: Radioactive Half-life And Dating Techniques
Students generate a radioactive decay table for an imaginary element using a box filled with pinto beans and M&M's. They use their data to plot a decay graph, develop the concept of half-life, and use the graph to "age" several samples.
Better Lesson
Better Lesson: Graphing With M&m's
M&M's can be used to create a unique data set and can be graphed by students
Alabama Learning Exchange
Alex: M&m's and Blogs: Interpreting Data!
In this hands-on, technology-rich lesson, learners will interpret data. The students will define words involving graphs, create a bar graph using M&M's, and post information from their findings on the internet. The learners will also...
Other
Delta State University: Lesson Plan 3: Pie Graphs
The students will gather, organize, and display data in an appropriate pie (circle) graph using M&M's! [PDF]
Texas Instruments
Texas Instruments: M&m's and Exponential Graphs
Students can use M&M's to model a decay equation - exponential equations.
Cyberbee
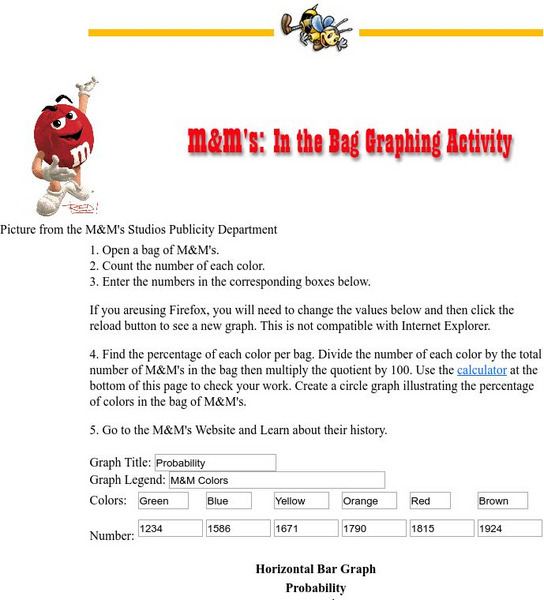
Cyberbee: M&ms in the Bag Graphing Activity
Use a bag of M&Ms to learn about probability. Includes graphs and percentages, and the steps needed for the students to duplicate the numbers.


