Curated OER
Stem-and-Leaf Plots
Seventh graders study steam-and-leaf plots. Given specific data, they create a stem-and-leaf plot . Students identify the mean, mode, range and median. Afterward, they review vocabulary words.
Curated OER
Range and Mode
In this graphing activity, 2nd graders focus on the range and the mode with the given data provided. Students study the chart and respond to four short answer questions.
Curated OER
Whole Numbers
A game is a great way to learn. Study what makes an integers, their traits, and characteristics. This lesson includes 3 separate activities intended to promote an understanding of integers, whole numbers, and opposites. The class is...
Curated OER
Candy is Dandy
Learners view the benefits of using graphs to communicate information, answer questions and solve problems. They investigate color distribution in bags of M & M's. Working with actual bags of candy, they will sort and classify contents.
Curated OER
Exponential Decay
Students study exponential decay and its application to radiocarbon dating. In this exponential decay lesson, students use candy to model the time it takes for something to decay. Students also graph the data they collect and...
Curated OER
Exploring Geometric Patterns and Relationships
Sixth graders explore different geographic relationships in like drawing lines, rays, and parallelograms. This lesson could be used for review because it covers more than one concept. The students should have prior knowledge.
Curated OER
What's The Teacher's Choice?
Fifth graders explore how to use data and display it using a chart or graph. They use food choices for categories and then gather the data and use the provided chart for display. In small groups students discuss the data and the results.
Curated OER
Quadratic Equations
Tenth graders review algebraic methods of solving quadratic equations. Students discuss several methods of solving quadratic equations. They practice factoring and finding the roots of an equation for solving. A calculator is used to...
Curated OER
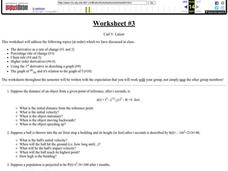
Worksheet #3, Derivative Rates, Percent Rate of Change, Chain Rule
In this calculus worksheet, students answer compute the distance of an object from a given point after t seconds when given the formula. They use the chain rule to answer 2 questions. Students compute the derivatives and sketch a graph...
Curated OER
Worksheet #6, Exponents, Interest, and Radioactive Decay of Isotopes
In this calculus worksheet, students sketch graphs of given exponential functions. They compute the principal needed to have a given ending balance when the interest is compounded at varying times. Students use a simple exponential model...
Curated OER
Worksheet #5, Concavity,
In this calculus activity, students determine the intervals in which a given relation is concave up. They determine the inflection points of a given formula. Students use the second derivative test to classify the relative extrema of a...
Curated OER
Venn Diagram and UK Basketball
Students analyze data and make inferences. In this algebra lesson plan, students collect and analyze data as they apply it to the real world.
Curated OER
Himalayan Herds: Fractional Exponential Growth
Students solve problems by identifying exponential growth and decay and differentiating between patterns, relation and functions. In this algebra lesson, students apply concepts of exponential growth to solve problems.
Curated OER
Area Unit
Students solve the area for parallelograms,squares, rectangles, trapezoids, and triangles. In this geometry lesson, students compare and contrast two dimensional shapes and apply their properties to solving real life scenarios. This is a...
Curated OER
The M&M's Brand Chocolate Candies Counting Book
First graders use estimation skills and gather data and record their findings
Curated OER
PASS the Arts
Learners explore math and art concepts, create digital art examples of the concepts, and incorporate these works into a PowerPoint portfolio with explanation and analysis.
Curated OER
Blast the Fats
Students examine the fats found in foods. In this nutrition lesson, students identify the types and amounts of fats found in foods as they research food labels and the Internet. Students classify the fats and record their data.
Curated OER
"M&Ms"® Candies Worksheet 1
In this math worksheet, students find the likelihood of different outcomes with the use of M and M's candy for the seven questions and fill in the graphic organizer.
Curated OER
How Many M&M's
Students explore sets and collections. Students find the colors of M&M's and the amount of M&M's each student has. They organize this information into an Excel spreadsheet. Students use the chart wizard to create a graph.
Curated OER
Bubblegum balls
Students look for patterns to solve problems involving statistics using different colored gumballs. They should be able to look for and find out all the possible outcomes based upon inference and trials.
Curated OER
Bungee M&M's
Eighth graders experiment with M&M's and a cup attached to a spring to to simulate a bungee jump. They graph the results of the experiment and make predictions for continuing the experiment. They determine the "line of best fit."
Curated OER
Teaching Radioactive Decay: Radioactive Half-life And Dating Techniques
Students generate a radioactive decay table for an imaginary element using a box filled with pinto beans and M&M's. They use their data to plot a decay graph, develop the concept of half-life, and use the graph to "age" several samples.
Curated OER
Fishy Frequencies
Tenth graders demonstrate that natural selection is an agent of evolution. They quantitatively apply the Hardy-Weinberg Principle to an imaginary population of fish. They utilize math and graphing skills, collecting and analyzing data,...
Curated OER
Children's Literature Across the Curriculum Ideas-Magic School Bus
Students read The Magic School Bus Gets Baked In A Cake: A Book About Kitchen Chemistry by Joanna Cole. They complete a variety of cross-curricular activities surrounding the study of kitchen chemistry. Included are reading, art, math,...


