Mathed Up!
Congruent Shapes
Are congruent shapes compatible? Congruent shapes are identical to one another, and throughout the assessment, young mathematicians identify given shapes as congruent.
Mathed Up!
Inequalities Regions
Discover how to solve systems of inequalities by graphing. An informative video shows pupils how to determine the solution set after graphing each inequality of a system. To finish, a worksheet gives them a chance to practice this skill.
Curated OER
Bird and Dog Race
Your pupil's pet dog and bird are racing down the city streets. In order to know who is going to win, they better know something about calculating rates, the Pythagorean Theorem, and applying those topics to the map of the city.
Wordpress
Introduction to Exponential Functions
This lesson plan begins with a review of linear functions and segues nicely over its fifteen examples and problems into a deep study of exponential functions. Linear and exponential growth are compared in an investment task. Data tables...
Mathematics Assessment Project
Functions
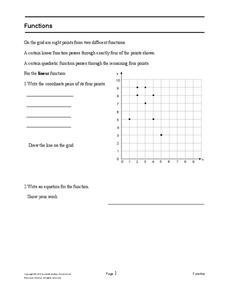
After identifying which of the given coordinate points fall on the graph of a line and which fall on the graph of a parabola, pupils write equations for each function.
Achieve
Stairway
It's the stairway to learning! Scholars research all aspects of building a staircase. Using information from building codes, they write and graph a system of inequalities to analyze the constraints. The completed project is a scale model...
Curated OER
Lesson #46: Bar Graphs and Line Graphs
In this bar graphs and line graphs learning exercise, students interpret bar graphs, line graphs, and box-and-whisker plots. They find the measures of central tendency. This three-page learning exercise contains notes,...
Curated OER
Finding the Area of Polygons
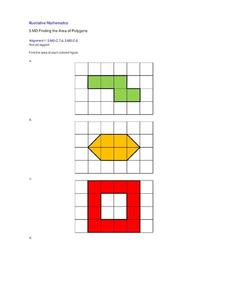
Third graders are exposed to finding the area of polygons by decomposing figures and recomposing them into rectangles. This strategy allows children to expand on their prior knowledge of constructing shapes by rearranging parts into...
Curated OER
You Can Get There From Here - Plotting on a Coordinate Plane
In this plotting worksheet, learners plot given ordered pairs on a coordinate plane. After plotting each ordered pair, students connect line segments in consecutive order. Upon completion of the graphing exercise, learners will have...
Curated OER
What's Brewing? Graphing On A Coordinate Plane
In this graphing worksheet, pupils graph given ordered pairs on a coordinate plane and connect the dots in consecutive order. Upon completion of the graphing exercise, students will have created a picture on the coordinate plane. They...
Curated OER
Plot the Coordinates
In this geometry skills learning exercise, learners plot the listed coordinates on the provided graphs to create letters of the alphabet.
Curated OER
Permutations
In this permutations activity, 6th graders solve and complete 5 different types of problems. First, they write a simple conceptual art plan with no more than 3 instructions. Then, students use graph paper and a pencil to draw a plan....
Curated OER
Follow the Directions: Street Map
In this directions activity worksheet, 5th graders must follow specific directions to complete the street map. Students must place several key locations on the map using the street grid.
Curated OER
Ordered Pairs
For this ordered pairs worksheet, 10th graders solve and graph 6 different sets of points on each graph. First, they draw each of the given ordered pairs in each problem on the gird shown. Then, students label each of these points on the...
Curated OER
Graphing Ordered Pairs
In this math worksheet, students learn to graph ordered pairs. Students examine a graph with 3 labeled points and tell the ordered pairs for each. Students also plot 8 ordered pairs on a graph they draw themselves.
Curated OER
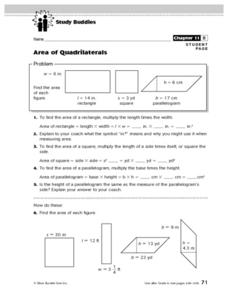
Area of Quadrilaterals
In this math worksheet, young scholars read an informative chart about how to find the area of quadrilaterals. Students then answer 6 questions in which the area of quadrilaterals is calculated.
Curated OER
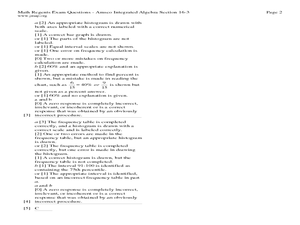
The Histogram
In this Algebra I/Algebra II worksheet, students construct and analyze histograms to develop a visual impression of the distributions of data. The two page worksheet contains five problems. Answer key is provided.
Curated OER
Slither Link
In this math puzzle activity, students draw one continuous loop through the dots on a grid. Some areas contain a number indicating how many lines may pass by that cell.
Curated OER
Bar Graph: Vacation Fun
In this bar graph activity, students use a bar graph showing pictures taken on a vacation to complete 6 related questions. Answers are included on page 2.
Curated OER
Vectors
In this Pre-calculus worksheet, students solve problems designed to help students develop a geometric visualization of vectors. The three page worksheet contains six multi-part questions. Answers...
Curated OER
Model Division: Reteach
For this division with models worksheet, students review two steps to help them divide with fractions. Students then match each question with the correct model and complete the division sentence. Students then complete each division and...
Curated OER
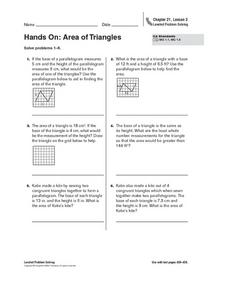
Hands On: Area of Triangles
In this area of triangles practice worksheet, students sharpen their problem solving skills as they solve 6 story problems.
Curated OER
Animal Runners
In this collecting data activity, 4th graders use the data shown on how fast 6 animals can run to create a bar graph. Students follow the instructions on 3 directives for their bar graphs and answer 1 short answer question.
Curated OER
Fraction Multiplication and Area
In this finding the area in fractions learning exercise, students read information about area and the formula, view examples, and write multiplication sentences that match pictures. Students solve three problems.

