Curated OER
Introduction to Bar Graphs Lesson Plan
Students organize and interpret data using bar graphs.
Curated OER
Roll `Em!
First graders engage in using base ten blocks and dice for a fun engaging math lesson. They use a worksheet imbedded in this lesson as the game board to help them play this math game.
Curated OER
Decisions, Decisions, Decisions
Students examine graphs to find the most appropriate for various kinds of data. For this graphing lesson, student create bar, line and circle graphs. Students create graphs electronically and manually interpreting the data.
Curated OER
What Does Time Have to Do with it?
Students investigate time. In this investigative lesson plan, students run through an obstacle course using standard timers. They record the time and apply this knowledge to problems in math. Students record their predictions, and graph...
Curated OER
Reaction Time
Third graders review important vocabulary to explain measures of central tendency and reaction time. In pairs, they measure reaction time of dropping and catching a ruler. Data is collected after repeated catches and information is...
Curated OER
Linear and Exponential Models
High schoolers investigate the differences between linear and exponential models. In this linear and exponential models lesson, students make a table of given data. High schoolers determine if the data is linear or exponential by...
Curated OER
Gravity, Angles, and Measurement
Students relate math to real life scenarios. In this geometry lesson, students launch a ball tracking each launch using a graph. They analyze their data for speed, angles and distance, trying to improve on each launch.
Curated OER
Usage and Interpretation of Graphs
Students explore graphing. In this graphing instructional activity, students predict how many shoe eyelets are present in the classroom. Students count eyelets and work in groups to organize and chart the data collected. Students put all...
Curated OER
Direct, Inverse and Joint Variation
Eleventh graders identify, create and solve word problems involving inverse variation. In this algebra lesson, 11th graders solve problems using direct, inverse and joint variation. They identify problems using these methods.
Curated OER
A Beating Heart
Students collect and analyze data using percent difference. In this algebra lesson, students relate the concepts of algebra to cardiac physiology.
Curated OER
Graphing Pasta
Students sort and graph various types of pasta. Using pasta construction paper patterns or real pasta, they sort the pasta by color, size, and type, and record the data on a graph.
Curated OER
Pythagorean Theorem
Students discover the Pythagorean Theorem. In this discovering the Pythagorean Theorem lesson plan, students measure the lengths of various triangles to the nearest centimeter. Students record their measurements in a table. Students...
Curated OER
Why Would I Owe My Soul to the Company Store?
Sixth graders listen to "Sixteen Tons" by Tennessee Ernie Ford and discuss what it means to owe one's soul to a store. In this mathematics lesson, 6th graders determine what a miner's income was minus his expenses graphing findings in a...
Curated OER
As Good As Gold
Students find examples of the Golden Ratio on the human body through measurement. Additionally, students learn about the use of the Golden Ratio and the Golden Rectangle in art and architecture. A very interesting lesson plan for the...
Curated OER
Getting to the Point
Students determine location by using the technique of triangulation. They imagine that they are out in the wilderness and have come to the top of a ridge. How can one identify the ridge on the topo map? How can one figure out where you...
Curated OER
1930 Census and the Consitution
Students read the Constitution and discuss the importance of enumeration. In this Census lesson, students complete a Census schedule and discuss the job skills of applicants. Students research Census data to compare and contrast the...
Curated OER
CSI Rhino
Students study the rhinoceros and how the species has survived for so long. In this rhino lesson students create graphs and research what is being done to protect the rhino.
Curated OER
Contaminated Drinking Water
Students predict, experiment, and draw conclusions about the safety of drinking water. In this ecology lesson plan, students participate in an experiment to determine if they can taste or see contamination in drinking water. Data is...
Curated OER
Questionnaires and Analysis
Students, review the techniques and different types of data analysis as well as how they are expressed, identify why facts and data are needed in conclusion of a questionnaire. The concepts of qualitative and quantitative data are...
Curated OER
Survey Project
Eighth graders create a website using FrontPage. They use inserted forms to collect survey information and use Microsoft Excel and MS Word to create a presentation of the survey and the results.
Curated OER
Student Heights
Students measure the heights of their fellow classmates and create a box and whisker plot to display the data. In this measurement lesson plan, students analyze the data and record results.
Curated OER
Misleading Graphs Lesson Plan
Students design and build water balloon catchers from random scrap materials, while taking into consideration a multitude of variables including: cost, maintenance, total capacity, etc.
Curated OER
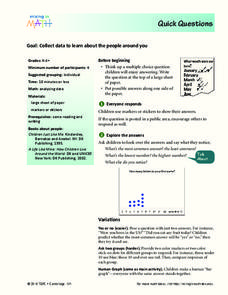
Quick Questions
Students ask their classmates survey questions. In this survey lesson, students come up with a question and possible answers. Their classmates mark their answers and the class discusses what they notice.
Curated OER
The Probability Scale
Students collect data and make predictions. In this probability lesson, students perform experiments calculating the chance of an event occurring. They draw conclusion based on their data.


