Curated OER
On the Road Again
Students work with patterns to develop formulas that will help them determine total cost. For this patterning lesson, students watch a video about an NBA trainer. (not included) They work in groups to access the assigned Internet...
Curated OER
Measuring the Egyptian Way using the Pythagorean Theorem
Students measure using the Pythagorean Theorem. In this geometry instructional activity, students solve right triangles using the properties of the Pythagorean theorem. They apply the same knowledge to solving story problems.
Curated OER
Data Analysis, Probability, and Discrete Math: Line Graphs
Eighth graders analyze data from line graphs. They discuss the purpose of line graphs, identify the parts of a line graph, answer questions about various graphs, and complete a worksheet. This lesson includes a script to teach along with.
Curated OER
Honing in on Hummingbirds
Students explore ruby-throated hummingbirds. In this cross-curricular hummingbirds lesson, students listen to the book The Mystery of the Missing Hummingbirds and choose related topics to research with a partner. Students draw or...
Curated OER
Measuring Soil Temperatures at South Penquite Farm
Students investigate soil temperatures. In this graphing and earth science lesson, students insert temperature probes into different types of soil at varying depths. Students complete a data chart and construct a related graph...
Curated OER
Prime Time Math: Emergency
Eighth graders, while using Prime Time Math: Emergency software, use math and medical data to participate in the diagnosis of a girl. Just like the medical team in the story, they will be using math to respond to a medical emergency- a...
Curated OER
Atlatl Lessons Grades 4-12: Lesson for Beginning Users of Atlatl
Sixth graders determine the mean, range median and mode of a set of numbers and display them. In this data instructional activity students form a set of data and use computer spreadsheet to display the information. They extend of...
Curated OER
Cost Calculations Lesson Plan
Students analyze data using graphs and equations. In this algebra activity, students calculate the cost of lumber, convert price per foot to price per piece, solve equations using addition and subtraction and give exact answer when...
Curated OER
Lessons for Atlatl Users with Some Experience-Grade 6
Sixth graders experiment with an atlatl and dart. In this sixth grade data management mathematics lesson plan, 6th graders explore and determine the most suitable methods of displaying data collected from their experimentation with...
Curated OER
Measurement and Paper Airplanes
Sixth graders investigate physics by creating paper airplanes. In this flight experiment lesson, 6th graders utilize stationary tools to create elaborate paper airplanes which they fly on their school grounds. Students complete...
Curated OER
Gummy Bear Math
First graders predict, collect data, and create a graph based on gummy bear colors they are given. In this graphing lesson plan, 1st graders first predict how many colors of gummy bears there are. They then count the colors, graph them,...
Curated OER
Water Pollution Lesson Plan: All Messed Up
Students map and calculate the area of the school parking lot and then the volume of water falling on the school parking lot. They map the route surface runoff will take to the nearest water body and describe the roles that human...
Curated OER
Lesson 9-3 Practice B: Composite Figures
For this composite figures worksheet, students solve 11 short answer problems. Students find the area of figures composed of various polygons. Students find the area of each figure given a sketch of the figure with various measurements...
Curated OER
Mayor Puts City on Diet to Lose a Million Pounds
Students read a story called Mayor Puts City on Diet to Lose a Million Pounds and answer vocabulary and comprehension questions about it. In this current event Lose a Million Pounds lesson plan, students respond to literature by...
Curated OER
College Costs are on the Rise
Young scholars examine college costs in different states. In this college cost lesson, students create a table and determine the average cost of college for the states listed. They organize the data into measurement categories. Young...
Curated OER
Inching Our Way through Measurement
Students review how to use an inch ruler and listen to the story, Inch by Inch by Leo Lionni. In this measuring lesson, students work in small groups to create an Inch Poster. Students then use an inch ruler to measure different objects...
Curated OER
Measuring Pattern Block Angles
Sixth graders identify various angles by using pattern blocks. In this measurement lesson, 6th graders find out how many degrees are in each of the different angles of the various pattern blocks.
Curated OER
Measuring Marvels
Learners discover how units of measurement help people to categorize objects. For this measurement lesson, students discuss various units of measurement, use creativity to invent new possible units of measure, and learn the history of...
National Research Center for Career and Technical Education
Health Science: Back to Basics
This lesson focuses on unit conversion, proportions, ratios, exponents, and the metric system. Discuss measurement with your math class and demonstrate how to solve several health-science word problems. Give learners a chance to visit an...
Curated OER
Rolling with Links
First graders explore geometry by completing a worksheet in class. In this non-standard measurement unit instructional activity, 1st graders discuss different techniques for measuring items without the use of a ruler. Students read...
Teach Engineering
Breathing Cells
Pairs work together to determine whether unknown solutions are either acids or bases by using a red cabbage indicator solution. After determining the general pH of the unknown solution, classmates blow into the same indicator after...
Virginia Department of Education
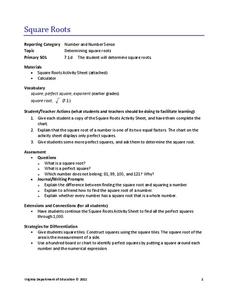
Square Roots
Square away any doubts about using a new resource. Pupils learn about squares and square roots in the mini-lesson. They complete a worksheet identifying roots of perfect squares up to 400.
EngageNY
Using Sample Data to Compare the Means of Two or More Populations II
The 23rd segment in a series of 25 presents random samples from two populations to determine whether there is a difference. Groups determine whether they believe there is a difference between the two populations and later use an...
Curated OER
Measuring Speed With iMovie
Learners record each other running, walking, throwing a ball, or doing a similar activity for a set distance. They import the video clips into iMovie. They compute how long it took in miles per hour.


