CPALMS
Cpalms: Measure Up! Measuring to Make a Line Plot
[Free Registration/Login Required] In this lesson, students will generate measurement data by measuring lengths using rulers marked with halves and fourths of an inch and show the data by making a line plot. This lesson includes an...
Math Planet
Math Planet: Algebra 2: Line Plots and Stem and Leaf Plots
Provides examples and a video lesson that illustrate line plots and stem-and-leaf plots. [1:12]
Khan Academy
Khan Academy: Estimating Equations of Lines of Best Fit and Making Predictions
Practice estimating the equation of a line of best fit through data points in a scatter plot. Then use the equation to make a prediction. Students receive immediate feedback and have the opportunity to try questions repeatedly, watch a...
University of Regina (Canada)
University of Regina: Math Central: Quiz Equation of a Line
Quiz on plotting equations, slope and intercepts, equation of a line, and special lines.
University of Regina (Canada)
University of Regina: Math Central: Quiz Equation of a Line
Quiz on plotting equations, slope and intercepts, equation of a line, and special lines.
University of Regina (Canada)
University of Regina: Math Central: Quiz Equation of a Line
Quiz on plotting equations, slope and intercepts, equation of a line, and special lines.
University of Regina (Canada)
University of Regina: Math Central: Basics of Graphing
Students learn the basics of graphing including terminology, plotting, and reading points. The lesson has an overview, materials, procedures, and evaluation techniques.
University of Regina (Canada)
University of Regina: Math Central: Basics of Graphing
Students learn the basics of graphing including terminology, plotting, and reading points. The lesson has an overview, materials, procedures, and evaluation techniques.
University of Regina (Canada)
University of Regina: Math Central: Scatter Plots
Three different concepts are examined about scatter plots. Topics featured are collecting data, analyzing scatter plots, and determining a line of "best fit". The lesson plan has an overview, material, procedures, and evaluation techniques.
Math Aids
Math Aids: Graph Worksheets
Great resource to practice and strengthen math skills pertaining to graphs. Math worksheets are printable, may be customized, and include answer keys.
University of Regina (Canada)
University of Regina: Math Central: Scatter Plots
Three different concepts are examined about scatter plots. Topics featured are collecting data, analyzing scatter plots, and determining a line of "best fit". The lesson has an overview, material, procedures, and evaluation techniques.
University of Regina (Canada)
University of Regina: Math Central: Linear Graphs
Learners gain the knowledge of how to plot and recognize first degree equations on a graph. The lesson has an overview, materials, procedures, and evaluation techniques.
Washington State University
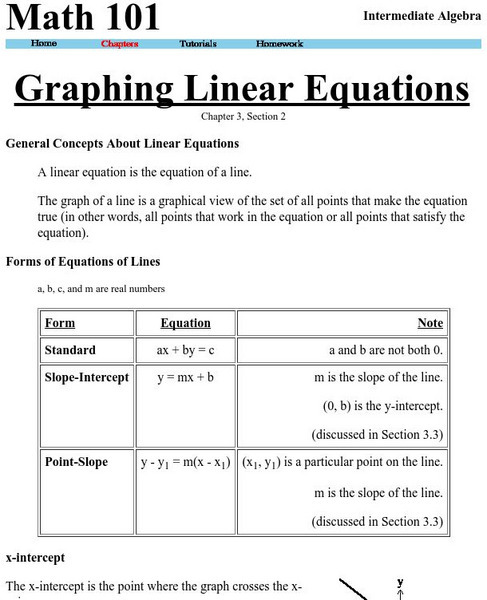
Washington State University: Graphing Linear Equations
This site explains what a linear equation is, general forms of linear equations, how to graph a line using the method of plotting points. The site also details how to find points on the line given the equation, information about the...
Khan Academy
Khan Academy: Linear Regression Review
Linear regression is a process of drawing a line through data in a scatter plot. The line summarizes the data, which is useful when making predictions.


