Hi, what do you want to do?
Khan Academy
Khan Academy: Creating Box Plots
More practice making box plots to summarize data sets. Students receive immediate feedback and have the opportunity to try questions repeatedly, watch a video or receive hints.
Khan Academy
Khan Academy: Estimating Slope of Line of Best Fit
Given a scatter plot, can you estimate the slope of the line of best fit that goes through the data points? Students receive immediate feedback and have the opportunity to try questions repeatedly, watch a video, or receive hints.
Quia
Ixl Learning: Line of Best Fit
Brush up on your math skills relating to the line of best fit then try some practice problems to test your understanding.
University of Waterloo (Canada)
Univ. Of Waterloo: Wired Math: Linear Graphing: Graphing and Analyzing [Pdf]
The mathematics resource assesses students on linear relations. The activity has problems with graphing and analyzing linear relations. Some of the topics included are variation, scatter plots and linear relationships. The worksheet has...
Khan Academy
Khan Academy: Interpreting Slope and Y Intercept of Lines of Best Fit
Practice explaining the meaning of slope and y-intercept for lines of best fit on scatter plots. Students receive immediate feedback and have the opportunity to try questions repeatedly, watch a video, or receive hints.
University of Regina (Canada)
University of Regina: Math Central: Quiz Equation of a Line
Quiz on plotting equations, slope and intercepts, equation of a line, and special lines.
University of Regina (Canada)
University of Regina: Math Central: Quiz Equation of a Line
Quiz on plotting equations, slope and intercepts, equation of a line, and special lines.
University of Regina (Canada)
University of Regina: Math Central: Quiz Equation of a Line
Quiz on plotting equations, slope and intercepts, equation of a line, and special lines.
University of Regina (Canada)
University of Regina: Math Central: Basics of Graphing
Students learn the basics of graphing including terminology, plotting, and reading points. The instructional activity has an overview, materials, procedures, and evaluation techniques.
University of Regina (Canada)
University of Regina: Math Central: Basics of Graphing
Students learn the basics of graphing including terminology, plotting, and reading points. The lesson has an overview, materials, procedures, and evaluation techniques.
University of Regina (Canada)
University of Regina: Math Central: Scatter Plots
Three different concepts are examined about scatter plots. Topics featured are collecting data, analyzing scatter plots, and determining a line of "best fit". The instructional activity has an overview, material, procedures, and...
University of Regina (Canada)
University of Regina: Math Central: Graphing Activities
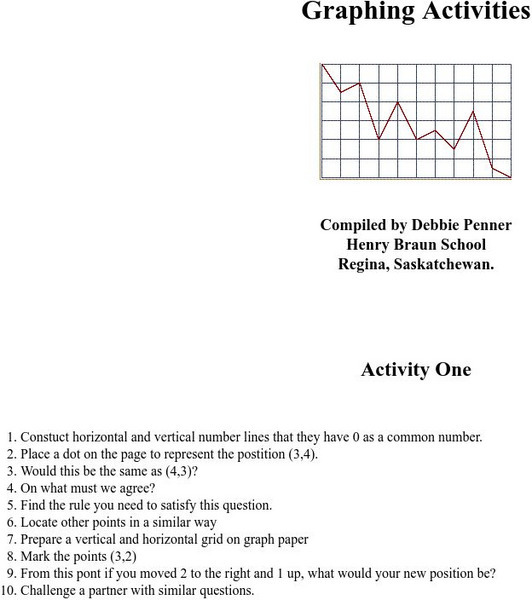
Eighteen different graphing activities will teach students how to plot points, draw lines, compare graphs, and problem solve.
Discovery Education
Discovery Education: Web Math: Using a Number Line
This WebMath site provides an interactive number line "solver." Content includes helpful hint and a full explanation of the mathematical solution.
University of Regina (Canada)
University of Regina: Math Central: Graphing Activities
Eighteen different graphing activities will teach students how to plot points, draw lines, compare graphs, and problem solve.
Texas Instruments
Texas Instruments: Math Today for Ti Navigator System: More Students Apply Early
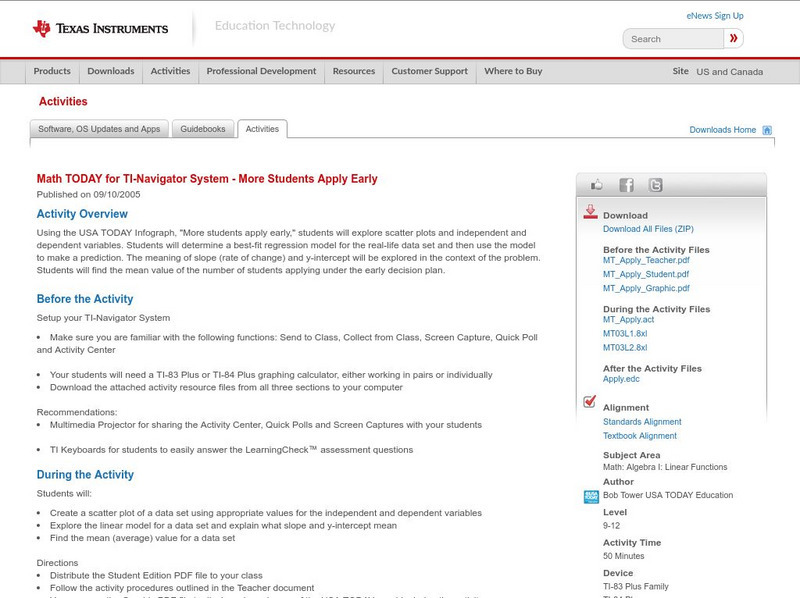
Using the USA TODAY Infograph, "More students apply early," students will explore scatter plots and independent and dependent variables. Students will determine a best-fit regression model for the real-life data set and then use the...


