Hi, what do you want to do?
Scholastic
Scholastic: Math Maven's Mysteries: The Bell Clapper Caper
Help the Math Maven get the kids out of school on time. Someone has stolen the bell's clapper and if the bell doesn't ring at 3:00, the school doors will not open! You have to figure out the last question to ask the number one suspect.
Other
Basket Math Interactive
Explore more than twenty math concepts such a perimeter, rounding, exponents, decimals, sign numbers, and more using this interactive basketball game. A Spanish version is also offered. Students results are tabulated daily.
Mensa Espana
Mensa Espana: Lista De Problemas
Spanish content. An extensive compilation of logic and reasoning problems approved by MENSA. Problems are arranged according to difficulty. Each problem is linked to it's solution. A terrific resource for extention and supplemental...
University of Cambridge
University of Cambridge: Nrich: Got It
Sharpen your logical thinking and see if you can figure out the strategy to get to the target number before the computer.
US Department of Education
Helping Your Child Learn Math: Math for the Fun of It
This compilation of math activities engages parents and children in the use of math whenever they are at home. Packed with concise, high interest activities, related illustrations, detailed "parent pointers," and easy to following...
Oswego City School District
Regents Exam Prep Center: Logic
Understanding mathematical language in problem solving can be a difficult concept to grasp. Sharpen your logical reasoning skills at this test prep site that explains the terms: if, and, or, implies, and only if, as they relate to math....
McGraw Hill
Glencoe Mathematics: Self Check Quiz on Reasoning & Proof
The online assessment demonstrates knowledge of concepts utilized in Geometry. The multiple choice questions test students on mathematical reasoning and proof.
PBS
Pbs Learning Media: Think Math
Think Math offers a collection of 43 KET-produced resources from Math at the Core: Middle School, including 17 Scale City videos and interactives about proportional reasoning, 14 Wild Fractions animations and games that feature visual...
University of Cambridge
University of Cambridge: Nrich: Highest and Lowest
On this one page website sharpen your logic and problem solving skills while working on this challenge. The solution is available to double check your solution.
Iowa State University
Math Night Resources: Pencil and Paper Games
Play these pencil and paper games to engage learners in critical thinking and reasoning. Written directions are provided along with colorful animation to explain in detail how each game is played and possible strategies needed to win.
Maths Challenge
Maths challenge.net: Painted Faces
Mathchallenge offers this mathematical reasoning problem, a one star problem requiring nothing more than a logical mind and paper and pencil, to deduct the painted faces problem
Math Planet
Math Planet: Geometry: Proofs Using Algebra
Examples and a video lesson help to explain proofs and logic. [1:57]
University of Toronto (Canada)
Question Corner: Deductive and Inductive Reasoning
A simple discussion of the differences between inductive and deductive reasoning. Helpful to anyone who is having difficulty differentiating between the two.
University of Cambridge
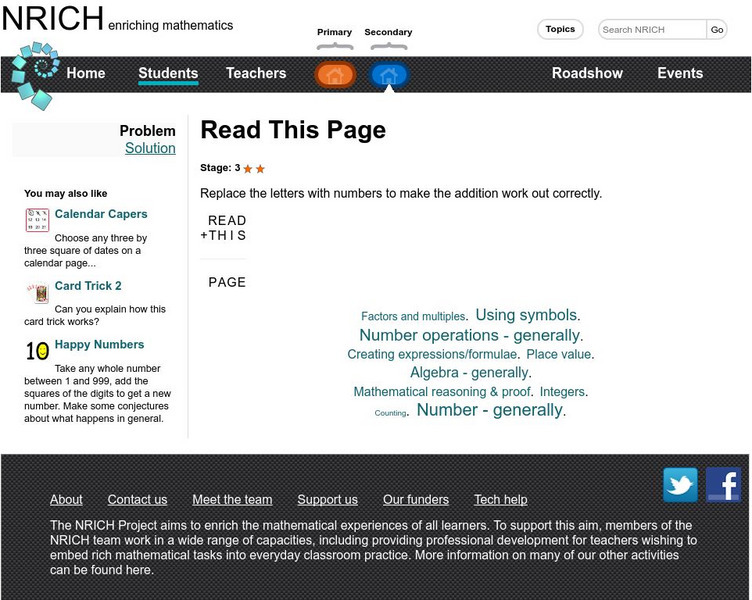
University of Cambridge: Nrich: Read This Page
On this one page website sharpen your logic and problem solving skills while working on this challenge. The solution is available to double check your solution.
University of Cambridge
University of Cambridge: Nrich: All the Digits
This site has a logic and reasoning math problem.
University of Cambridge
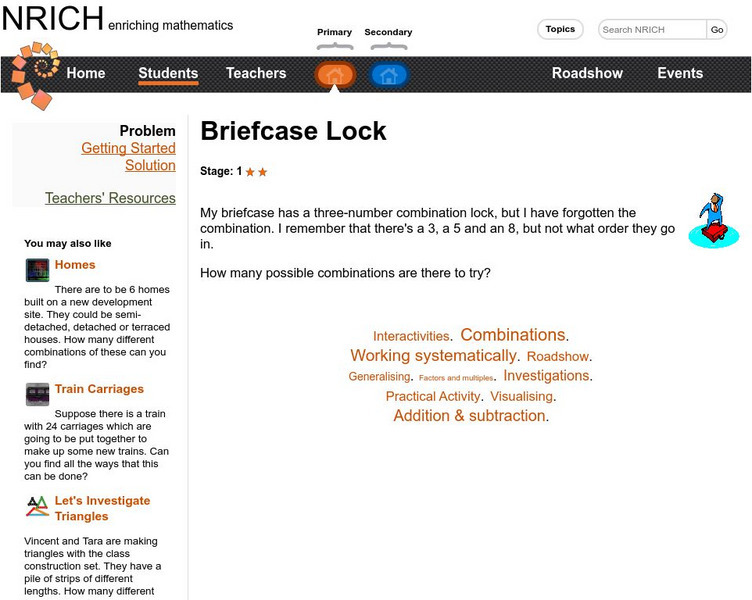
University of Cambridge: Nrich: Briefcase Lock
Use logic and reason to figure out what the correct combination of numbers are for the locked briefcase. At this one page website you can also check the solution.
University of Cambridge
University of Cambridge: Nrich: Whose Sandwich?
On this one page website logic and reason will help you figure out who ordered which sandwich. Check your results against the solution they provide at this website.
University of Cambridge
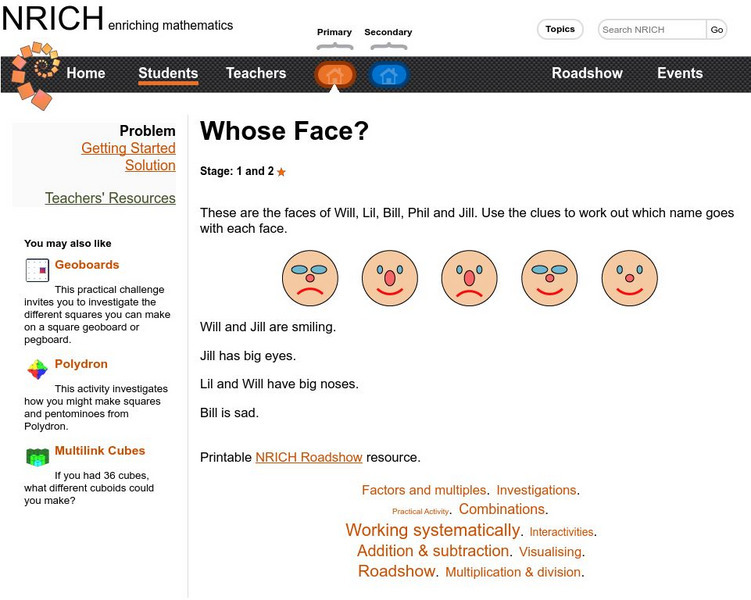
University of Cambridge: Nrich: Whose Face?
This is a logic and reasoning problem to help you sharpen your problem solving skills on this one page website. Now just "face" it and see if you can find the solution to "Whose Face"!
National Council of Teachers of Mathematics
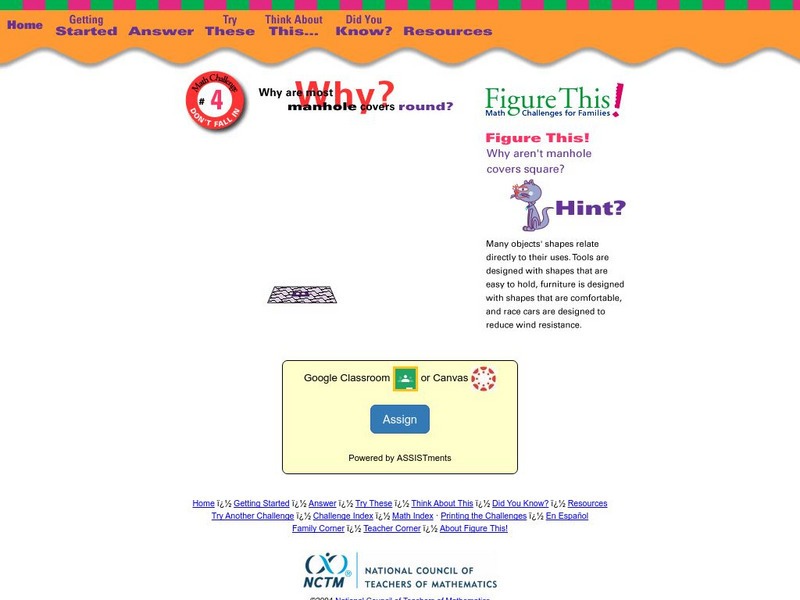
Nctm: Figure This: Don't Fall In
Have you ever wondered why manhole covers are round? Believe it or not, there is a logical, mathematical reason. See if you can figure it out in this NCTM Math Challenge for Families activity. A one-page activity with suggested life...
National Council of Teachers of Mathematics
Nctm: Figure This: Thirteen? Oh No! (Pdf)
If you're superstitious you may want to try this math challenge. Test your reasoning and number sense skills by finding out if there is a Friday the 13th every year. Discover how understanding number patterns and reasoning can be helpful...
PBS
Pbs Learning Media: Logical Leaps: Fractions, Mixed Numbers, and Decimals on the Number Line
n this interactive, students use logic to solve three riddles involving a frog jumping contest and then place the contestants' jumps at the correct points on the number line.
PBS
Pbs Learning Media: Logical Leaps: Fractions, Mixed Numbers, and Decimals on the Number Line
In this interactive, students use logic to solve three riddles involving a frog jumping contest and then place the contestants' jumps at the correct points on the number line. Numbers are randomized so that the frogs' placements on the...
PBS
Pbs Learning Media: Logical Leaps: Rational Numbers on the Number Line
In this interactive, use logic to solve riddles involving a wallaby jumping contest. Then, place each contestant's jump -- a fraction, mixed number, or decimal between -5 and +5 -- at the correct point on the number line. Backward jumps...
PBS
Pbs Learning Media: Logical Leaps: Fractions and Decimals From 0 to 1 on the Vertical Number Line
In this interactive, use logic to solve riddles involving a flea-jumping contest. Place each contestant's jump, represented by either a fraction or a decimal in both feet and inches, at the correct point on the vertical number line....


