Hi, what do you want to do?
Alabama Learning Exchange
Alex: Estimation Station
During this lesson, students will learn the difference between estimation and guessing. Knowing how to estimate is an essential skill that will help students determine approximate totals as well as check the reasonableness of their...
Beacon Learning Center
Beacon Learning Center: All That Data
Students analyze data by finding the mean, median, mode, and range of a set of numbers. Line plots, bar graphs, and circle graphs are also included in this lesson.
Varsity Tutors
Varsity Tutors: Hotmath: Practice Problems: Statistics
Fifteen problems presented on the topics: mean, median, mode, outliers and graphing statistics. They are given with each step to the solution cleverly revealed one at a time. You can work each step of the problem then click the "View...
Texas Instruments
Texas Instruments: Statistics for Math B
Students will determine the mean, median, mode and standard deviation of collected data. They will make a frequency histogram of the grouped data, both on graph paper, and on the TI 83+.
Math Is Fun
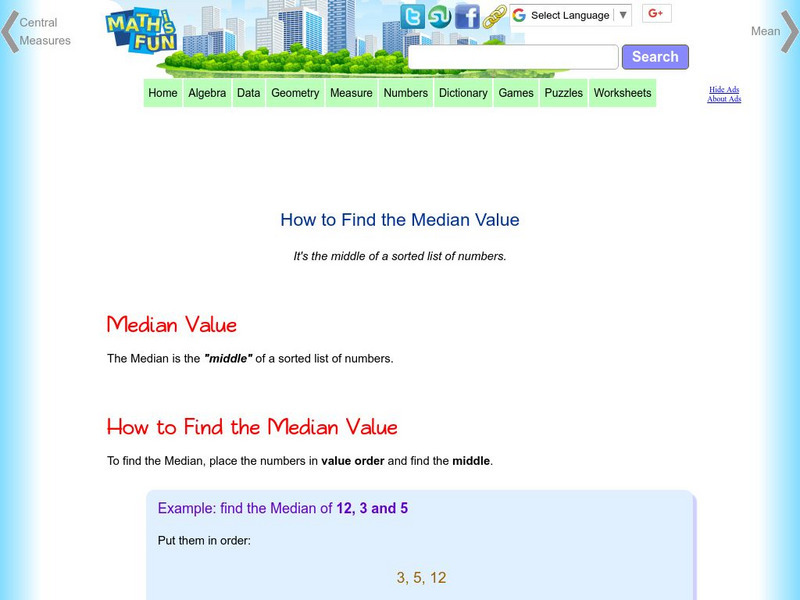
Math Is Fun: How to Find the Median Value
This math tutorial provides an explanation of the median value for a groups of numbers.
Math Is Fun
Math Is Fun: How to Find the Mode
This website gives a clear, simple explanation of how to find a mode.
Curated OER
Clip Art by Phillip Martin: Mean Median Mode Range
A clipart illustration by Phillip Martin titled "Mean Median Mode Range."
Louisiana Department of Education
Louisiana Doe: Louisiana Believes: Eureka Math Parent Guide: Statistics
A guide to support parents as they work with their students with statistics.
Texas A&M University
Wtamu Virtual Math Lab: Beginning Agebra: Central Tendencies
A tutorial to understand the three central tendencies and how to find them, as well as the standard deviation of values. Offers a discussion and practice problems.
E-learning for Kids
E Learning for Kids: Math: Olive Trees: Data & Chance
Ariel is taking a survey. Do you want to help her collect and describe data?
Math Slice
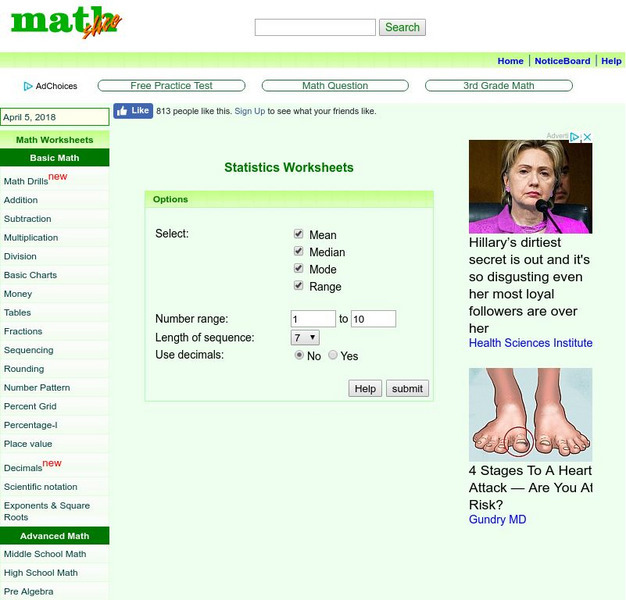
Math Slice: Statistics: Math Worksheets
This tool allows you to create worksheets where students calculate the mean, median, mode or range of a set of numbers.
Palomar Community College District
Palomar College: Mode, Median, Mean Examples
A series of step-by-step worked problems demonstrating how to take a set of data and produce the measures of central tendency. Hints are provided along the way and the final measures are shown for the user to check.
Oswego City School District
Regents Exam Prep Center: Central Tendency: Mean, Mode, Median
This tutorial discusses mean, median, and mode. It introduces the frequency table and gives several examples. A practice page is included and a teacher resource page that contains an activity using manipulatives.
Khan Academy
Khan Academy: Center and Spread Lesson
The resource from Khan Academy provides practice questions for the Praxis Core Math Test. This section reviews probability and statistics questions connected to the center and spread of data in a collection.
Math Aids
Math Aids: Mean Mode Median Worksheets
Great resource to practice and strengthen math skills pertaining to mean, mode, and median. Math worksheets are printable, may be customized, and include answer keys.
Education Development Center
Math Partners: Statistics and Probability [Pdf]
Comprehensive unit that consists of lessons and activities designed to help students learn statistics and probability concepts.
Math Is Fun
Math Is Fun: How to Find the Mean
This math tutorial illustrates the mean of a set of data.
Education Place
Houghton Mifflin: Eduplace: Math Steps: What Is It? Data
This is a great place for lesson information on the concept of analyzing data - measures of central tendency. Three other tabs are available besides the "What Is It?" link. Tips and Tricks, When Students Ask, and Lesson Ideas also...
E-learning for Kids
E Learning for Kids: Math: Music Center: Mixed Problem Solving
Help Dracco the drummer with solving different fun math problems.
McGraw Hill
Glencoe Mathematics: Quiz on Measures of Central Tendency
Students examine advanced mathematics concepts with this online quiz. The assessment shows comprehension of measures of central tendency. Topics include mean, mode, and median.
Ducksters
Ducksters: Kids Math: Probability and Statistics Glossary and Terms
Math glossary and terms on probability and statistics for kids. Learn the definitions used in this mathematics subject such as mean, median, and mode on this site.
Alabama Learning Exchange
Alex: "Ridin' Along in My Automobile"
Students will research prices of used cars to discover how automobiles lose their value over time. Students will create a chart to record their information, use their chart to graph their data, and find measures of central tendency of...
Beacon Learning Center
Beacon Learning Center: All That Data 2
Students describe graphs and explore range, measures of central tendency, and distribution in this interactive web lesson.
Soft Schools
Soft Schools: Probability and Statistics Quiz
Students are asked to find the mean, median, mode, and range of a data set. Also, they must be able to interpret graphs and tables, and graphically represent data. The quiz is multiple choice and consists of nine questions, and a summary...
Other popular searches
- Math; Mean, Median, Mode
- Math Mean Median Mode
- Math/data Mean Mode Median
- Math Ata Mean Mode Median
- Math/ Mean, Mode, Median
- Math at Mean Mode Median
- Math/ Mean Mode Median


