Curated OER
Student Costs Data Table
Students compare and contrast two routes selected for a virtual field trip. They create a data table of educational activities, lodging, and meal costs using Microsoft Excel software.
Curated OER
Highs and Lows
Solve problems using integration and derivatives. By using calculus, learners will analyze graphs to find the extrema and change in behavior. They then will identify the end behavior using the derivatives. Activities and handouts are...
Curated OER
Choose The Appropriate Graph
Fifth graders work in groups to investigate the proper use of a graph during a schoolyard ecology project. The challenge of the project is for students to choose the proper form of a graph. They gather data and conduct analysis with the...
Curated OER
Understanding 10: Backwards and Forwards
Help your young mathematicians completely master 10 by practicing one-to-one correspondence, number recognition, and recording numbers displayed. They make 10 with groups of two-different colored cubes and color in 10-frames to show how...
Curated OER
Shaping Up!
Kindergartners are introduced to basic shapes. Learners spend 45 minutes a day in geometry centers carrying out the activities outlined in this ambitious plan. There are games, hands-on activities, interactive websites, art projects,...
Curated OER
How Does Your Population Grown?
Do you know how the population has grown of your community? Can you predict the population over the next half century? Can we find an algebraic model that matches our data? These along with many more questions can be researched by...
Curated OER
Linear Inequalities in One and Two Variables: Rays and Half Planes
Define rays and half planes, including the concepts of boundary lines and prerequisite knowledge of coordinate planes. Given linear inequalities in one and two variables, your class will compare the differences. They will also graph...
Curated OER
Graphs and Functions
Use this series of activities to introduce learners to graphing functions. They graph both linear and quadratic equations by hand and with a Graph Sketcher Tool. Several imbedded links and handouts are included in the lesson.
Pennsylvania Department of Education
Numbers Are Made of Parts
Children play with barnyard animal cards to practice composing and decomposing numbers. With their "secret number" of animal cards in a cup, they shake and spill them onto a barn story board, counting how many animals fall in the barn...
Curated OER
Introduction to Statistics: Mean, Median, and Mode
Students explore the concepts of mean, median, and mode. They develop an understanding and familiarity with these concepts. Students explore mean and median in an efficient way. Students explore three different measures of center.
Curated OER
Fire!, Probability, and Chaos
Upper elementary and middle schoolers work with the concept of probability. They are introduced to the concept of chaos. Learners graph and analyze using a line plot, work with mean, and are introduced to the concept of variance.
Curated OER
Box Plots
Young statisticians are introduced to box plots and quartiles. They use an activity and discussion with supplemental exercises to help them explore how data can be graphically represented.
Curated OER
Understanding Fractions - Cookbook Comparisons
Learners explore equal fractions in relationship to a whole unit. They fold strips of paper into halves, thirds, etc. and compare them to the first strip which represents a "whole unit." Fractional parts are identified and compared.
Curated OER
Application and Modeling of Standard Deviation
The first activity in this resource has learners computing the mean and standard deviation of two different data sets and drawing conclusions based on their results. The second activity has them using a dice-rolling simulation to...
Curated OER
Maximize It!
Pupils design a rectangular box without a lid that has the largest possible volume using the supplied sheet of centimeter graph paper. They work in groups to construct different size boxes to determine the largest possible volume and...
Curated OER
MP3 Purchase Plans
Use algebra to solve real world problems. Mathematicians practice use of graphs, tables, and linear functions to solve a problem regarding mp3 purchase plans. They work in groups to solve the problem and present their findings and...
Pennsylvania Department of Education
Thinking About Numbers from 1 to 20
Help your kindergarteners discover new number-sense concepts and to compose and decompose numbers. Though the resource contains no procedural details, the assessment tool (which you can find in the "printer friendly version") has...
Curated OER
Buying a Car
Eighth graders create spreadsheets to calculate payments. They create a list of items they would like to purchase that require monthly payments. They simulate buying a car and create a spreadsheet to determine the amount of the monthly...
Curated OER
We the People: A Study in American Voter Turnout: US Government
Students examine and compare voter turnout in US Elections. They write a letter to a favorite candidate or representative suggesting ways to increase voter turnout.
Curated OER
Converting Fractions to Decimals
Seventh graders take a simple fraction and give it decimal form either by the use of equivalent fractions or division with a calculator.
Curated OER
Arranging Numbers from 1 to 5
Kindergarteners arrange manipulatives or everyday objects in groups of one through five. They identify groups seen in pictures of nature and compare same numbers of different objects.
Curated OER
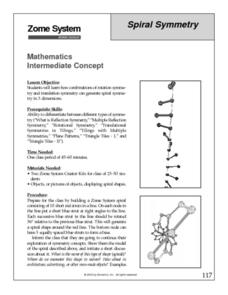
Spiral Symmetry
Taking the notion of symmetry to the next level, this looks at combining rotation and translation symmetry to build spiral symmetry in three dimensions. Using the Zome modeling system and an instructor’s guidance, geometers try to build...
Curated OER
Rainbows, Bridges & Weather, Oh My!
Explore how real-world applications can be parabolic in nature and how to find quadratic functions that best fit data. A number of different examples of modeling parabolas are explored including a student scavenger hunt, the exploration...
Curated OER
Impossible Graphs
Students practice plotting functions on the Cartesian coordinate plane while participating in a discussion about the Possible Or Not worksheet/activity. Students also use the Impossible Graphs worksheet to practice reading a graph,...

